
Say what you want about Brexit news or president Trump news, we only care about the chart! Our analysis and decisions do NOT depend on news but solely on what we refer to “the right side of the market”. Traders, today we will look at a couple of GBPUSD charts. The following analysis will show you no matter how choppy the market is, how efficient it can be to trade with our rules.
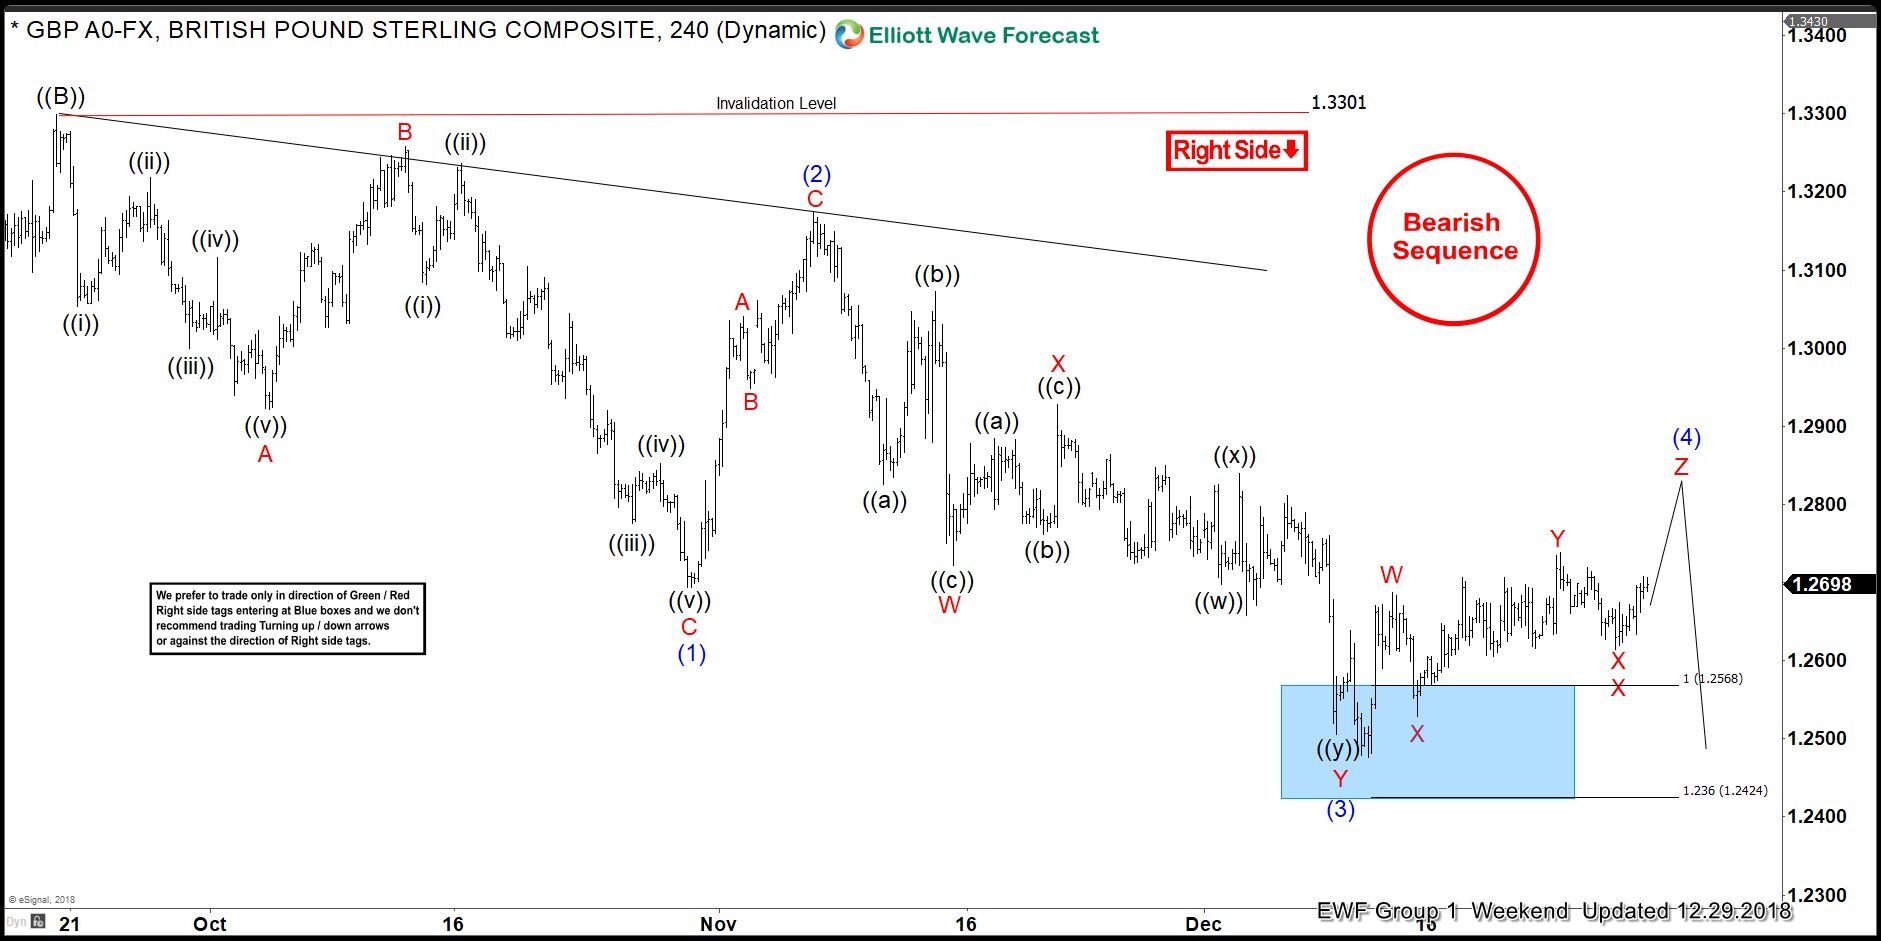
First of all, we start with GBPUSD’s 4 hour chart from December 29th 2018 presented to our members. At the time, the pair held an incomplete bearish sequence due to the broken low of August 15. When that happened, we confirmed a same degree 3 swing move, ((A))-((B))-((C)), to the downside. This also meant, a clear 5 wave move within wave ((C)). Moreover this scenario gave us the possibility to map an “equal leg” target area of 1.12568-1.2424 . From there, a significant reaction was to be expected correcting the full 3 swing sequence down.
Our count at the time suggested an ending diagonal with a 5th leg still missing, hence our aggressive bearish stance. Notice our red “right side” arrow and of course our “bearish sequence stamp”. Given these signals, our approach unquestionably encourages our members to trade with the right side. So, some members were looking to sell the bounce of the expected wave (4) in 3,7, or 11 swings.
GBPUSD 12.29.2018 4 Hour Chart Elliott Wave Analysis
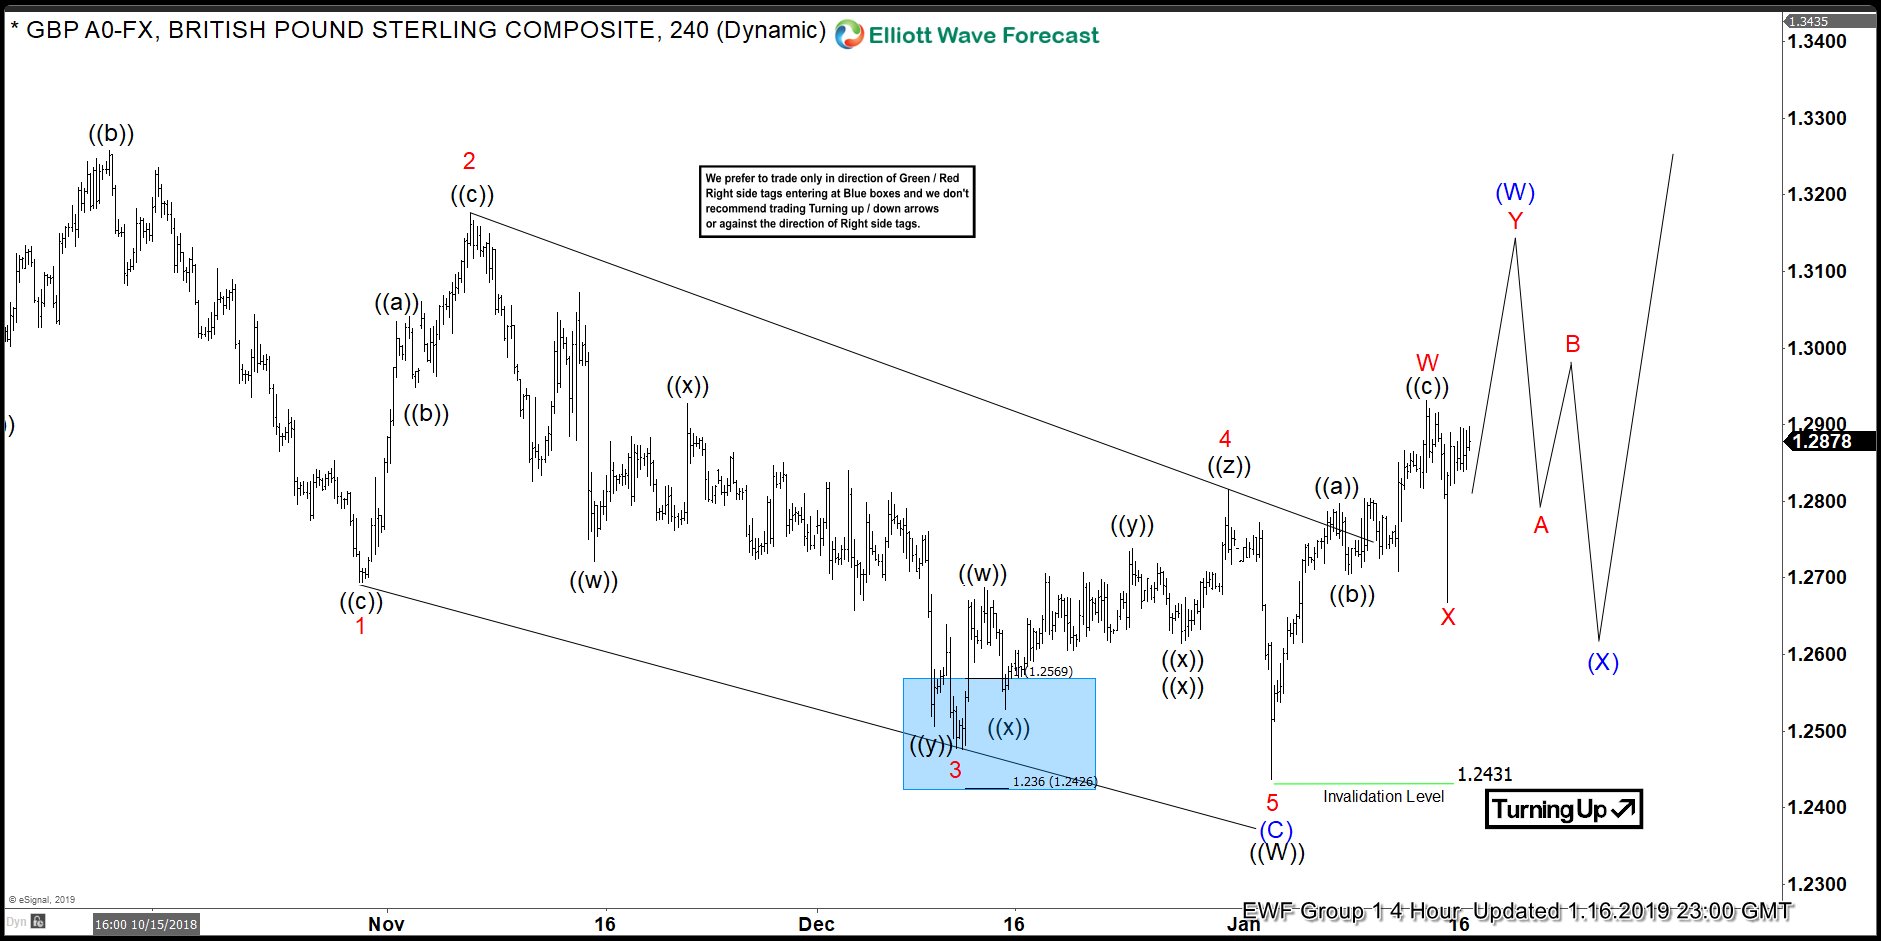
Below you can see an updated chart of the pair from January 16 2009. Notice how the pair came back for a lower low for wave 5 (previously label “(5)”), and bounced out of the previously defined target area within minutes! Certainly, the best type of reaction to start the correction of October highs.
A mapped entry, an invalidation level set up, sequences, and “the right side” add up to great trading opportunities. Above all, being on “the right side” of the market proves once again to be successful preventing us from taking a bullish perspective at the wrong time.
GBPUSD 01.16.2019 4 Hour Chart Elliott Wave Analysis
*Note : Keep in mind the market is dynamic and the presented view might have changed after the post was published.