
In this technical blog, we are going to cover past performance as well as some recent 1 hour Elliott Wave Charts of Copper, that we presented to our clients. We are going to explain the structure and the forecast below.
Copper 1 Hour Elliott Wave Chart From 12/29/2018
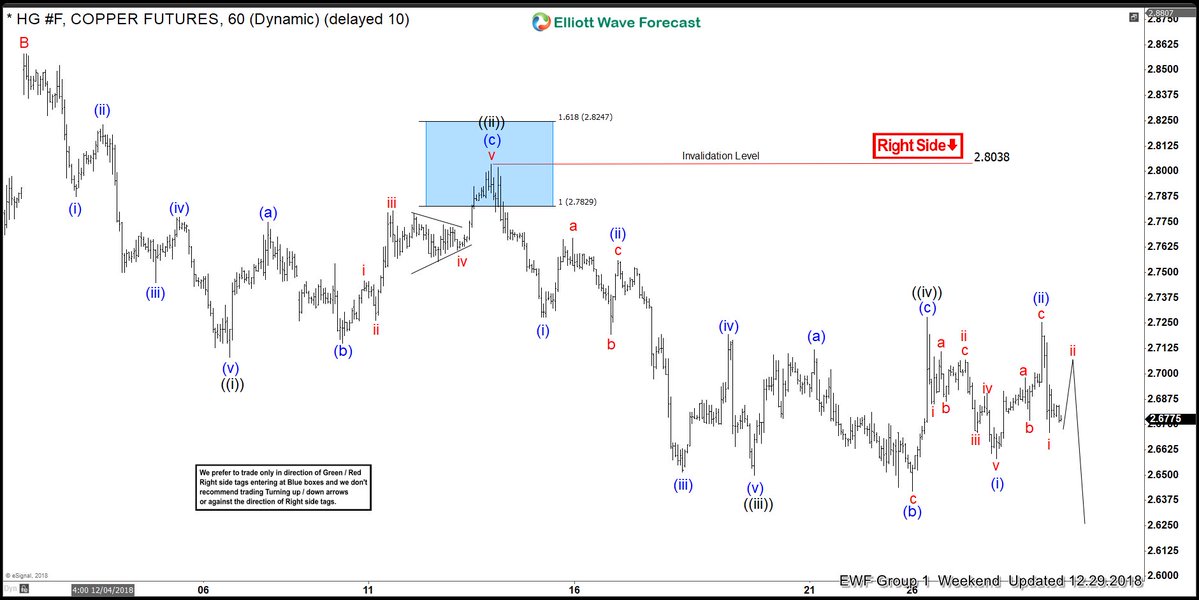
Above is the 1 Hour Chart from 12/29/2018 Weekend update, in which the decline from 12/03/2018 peak ($2.856) was expected to take place in 5 wave impulse structure within Minor wave C lower. Also, the sub-division from 12/03 peak in lesser degree decline unfolded in 5 waves impulse structure i.e Minute wave ((i)) & ((iii)). Which favored more downside for another extension lower in lesser degree Minute wave ((v)) against $2.8038 peak, while Minute wave ((iv)) being called completed at $2.726 peak as a Flat structure.
Copper 1 Hour Elliott Wave Chart From 1/03/2019
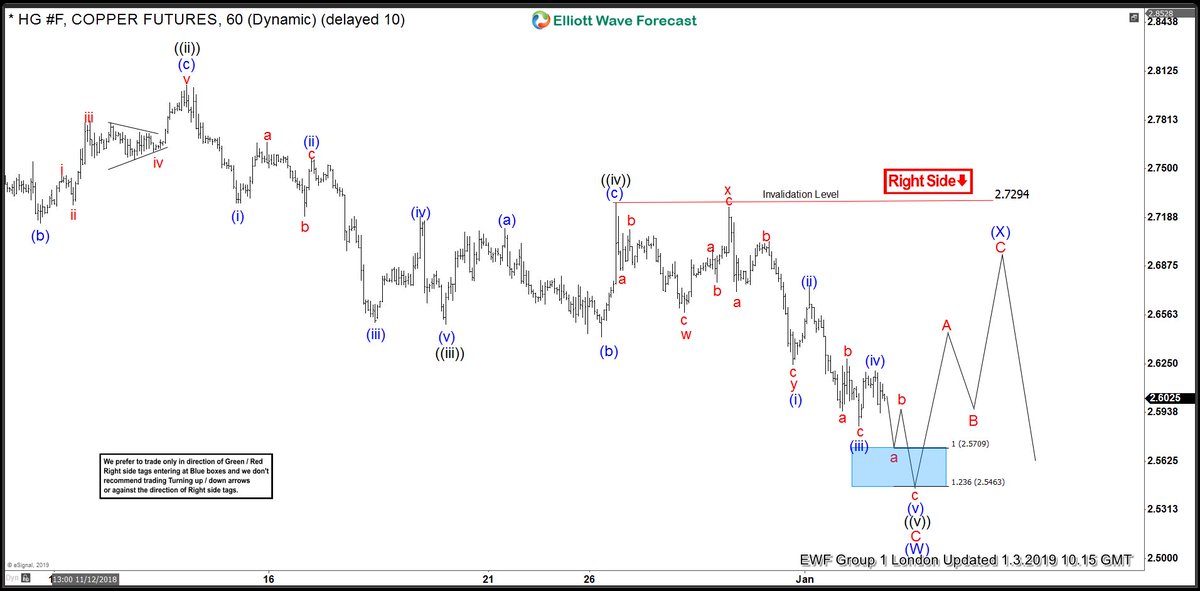
Copper 1 Hour Elliott Wave Chart from 1/3/2019 London update, the metal failed to new lows in Minute wave ((v)) as expected. Looking to reach $2.5709-$2.5463 100%-123.6% Fibonacci extension area of Minute wave ((i))=((v)) target blue box area before it ends the Minor wave C as well as intermediate wave (W) lower & bigger 3 wave bounce develops.
Copper 1 Hour Elliott Wave Chart From 1/08/2019
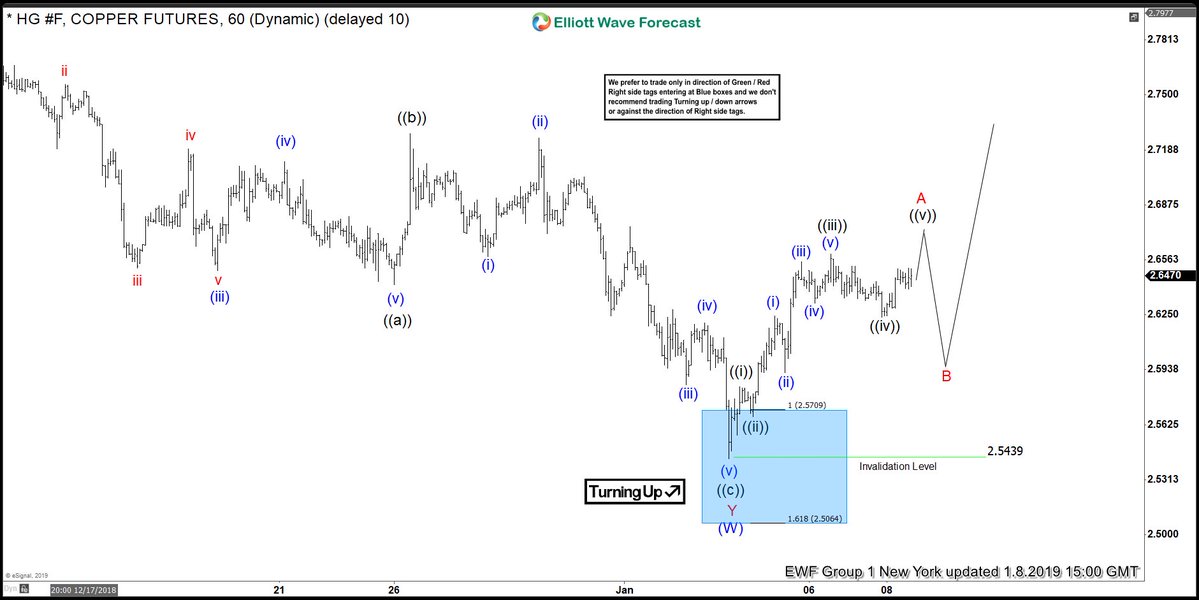
Copper 1 Hour Elliott Wave Chart from 1/8/2019 NY update, metal made the last push lower as expected & started bounce higher from the aforementioned blue box area as expected. Please note that we adjusted the count slightly to double three instead of a Zigzag based on our distribution & correlation system. Now coming back to the chart, the metal placed the low at $2.5439 & continued the bounce higher as zigzag structure.
Copper 1 Hour Elliott Wave Chart From 1/15/2019
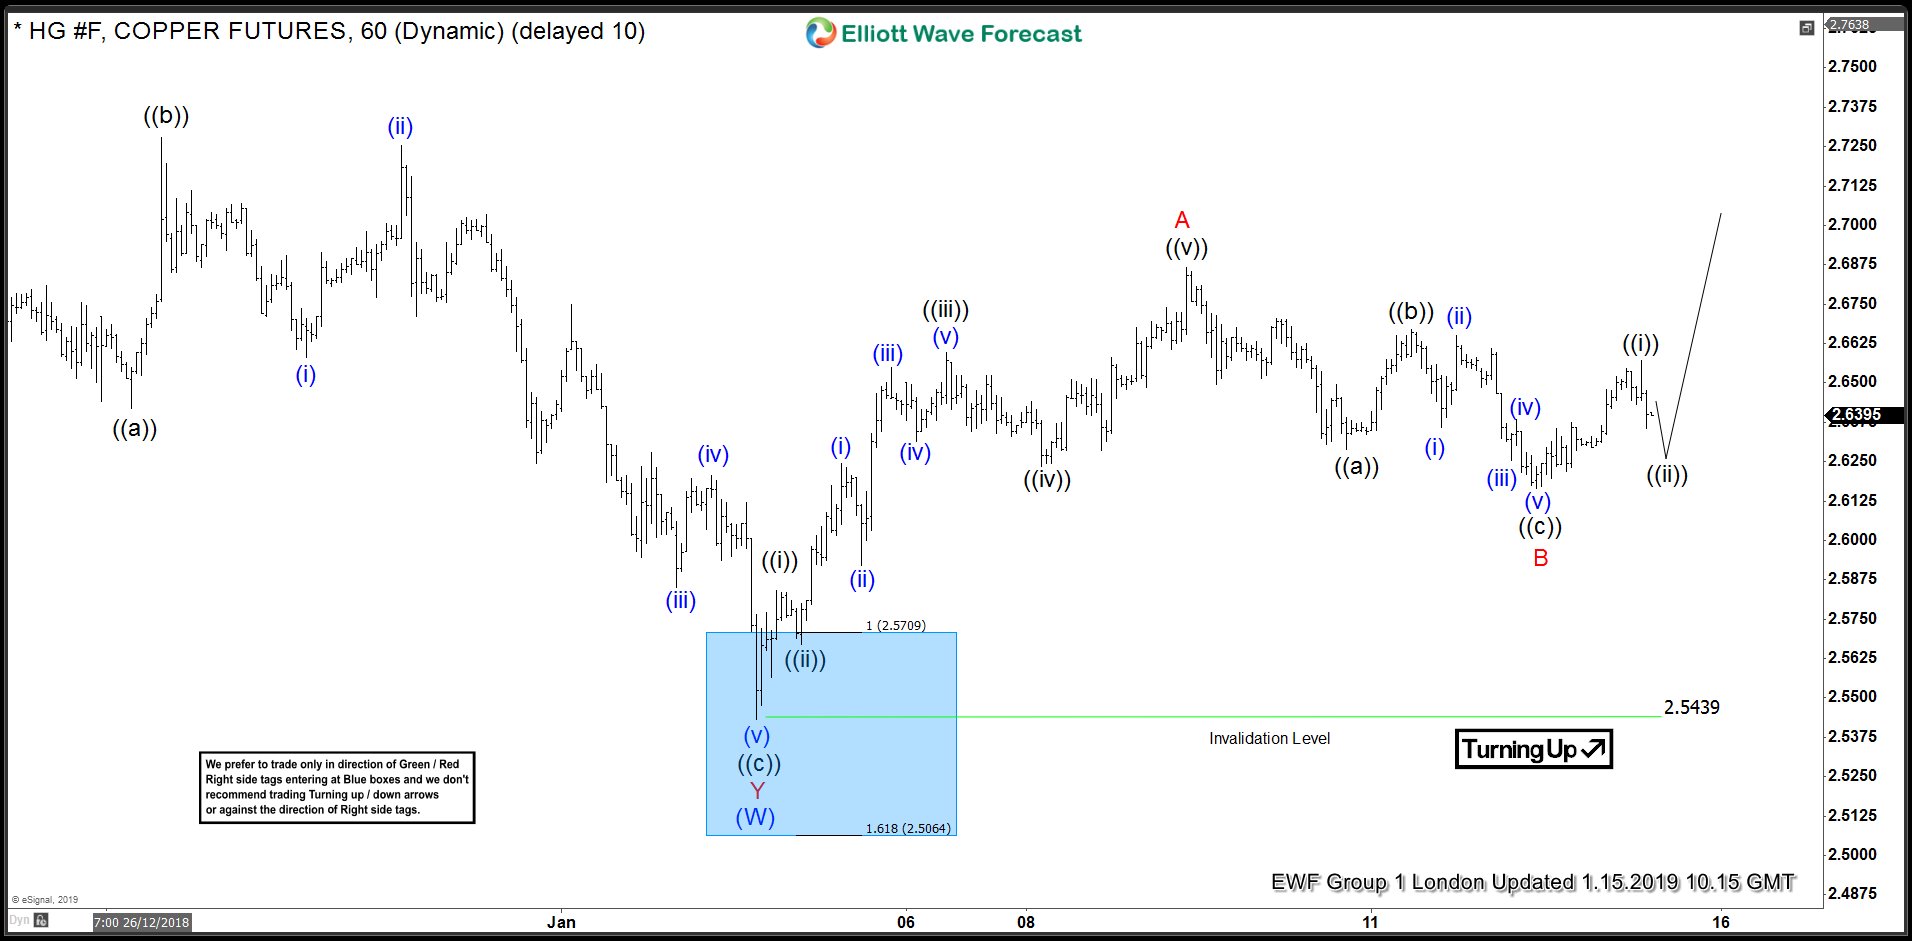
Copper 1 Hour Elliott Wave Chart from 1/15/2019 London update, in which the metal ended the first leg of a bounce in lesser degree 5 waves structure within Minor wave A at $2.686 high. Down from there, Minor wave B is proposed complete at $2.616 low. While dips remain above there and more importantly expect Copper to extend higher in Minor wave C towards $2.759-$2.848 100%-161.8% Fibonacci extension area of Minor A-B before next selling opportunity appears looking for 3 wave reaction lower at least.
Keep in mind that the market is dynamic and the view could change in the meantime. Success in trading requires proper risk and money management as well as an understanding of Elliott Wave theory, cycle analysis, and correlation. We have developed a very good trading strategy that defines the entry. Stop loss and take profit levels with high accuracy and allows you to take a risk-free position, shortly after taking it by protecting your wallet.