
MicroStrategy (NASDAQ: MSTR) faced a 58% correction from its November 2024 peak. Meanwhile, Bitcoin resumed its rally this year and already reached new all-time highs. However, the stock continues to lag behind, failing to match Bitcoin’s bullish pace. In today’s article, we explore MSTR’s Elliott Wave structure and outline the bullish paths and key targets that may unfold next.
Elliott Wave Analysis
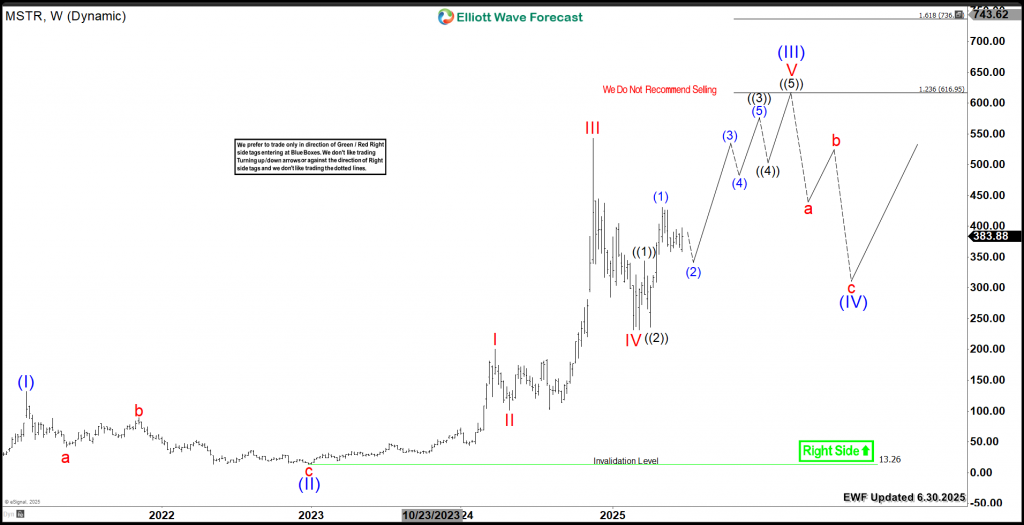
Starting from the December 2022 low, MSTR has formed three bullish swings into new highs. However, the sequence remains incomplete. Therefore, the stock should extend higher with a fifth swing, aiming to complete a standard impulse pattern.
Meanwhile, the 2025 low is labeled as wave IV, and the April pullback to $230 marks a critical low. As long as MSTR holds above that level, the structure favors further upside, potentially driving the next breakout toward new all-time highs.
The projected upside target for MSTR aligns with the inverted Fibonacci levels of wave IV, falling between $616 and $736. This zone reflects at least another +60% move, suggesting strong bullish potential. Moreover, depending on how the structure unfolds, the stock may extend beyond this range, especially if momentum builds into wave V acceleration.
MicroStrategy MSTR Weekly Chart 6.30.2025
Conclusion
MicroStrategy (MSTR) continues to show a bullish sequence, supporting further upside and helping the stock catch up with Bitcoin’s rally. As momentum builds, traders can capitalize on daily pullbacks using our Elliott Wave strategy.
The ideal strategy is to continue buying pullbacks after MSTR completes 3, 7, or 11 swings from its recent peak. Meanwhile, our extreme Blue Box system enhances accuracy, helping traders pinpoint entry levels with confidence and clarity.
Source: https://elliottwave-forecast.com/stock-market/mstr-elliott-wave-signals-record-highs/