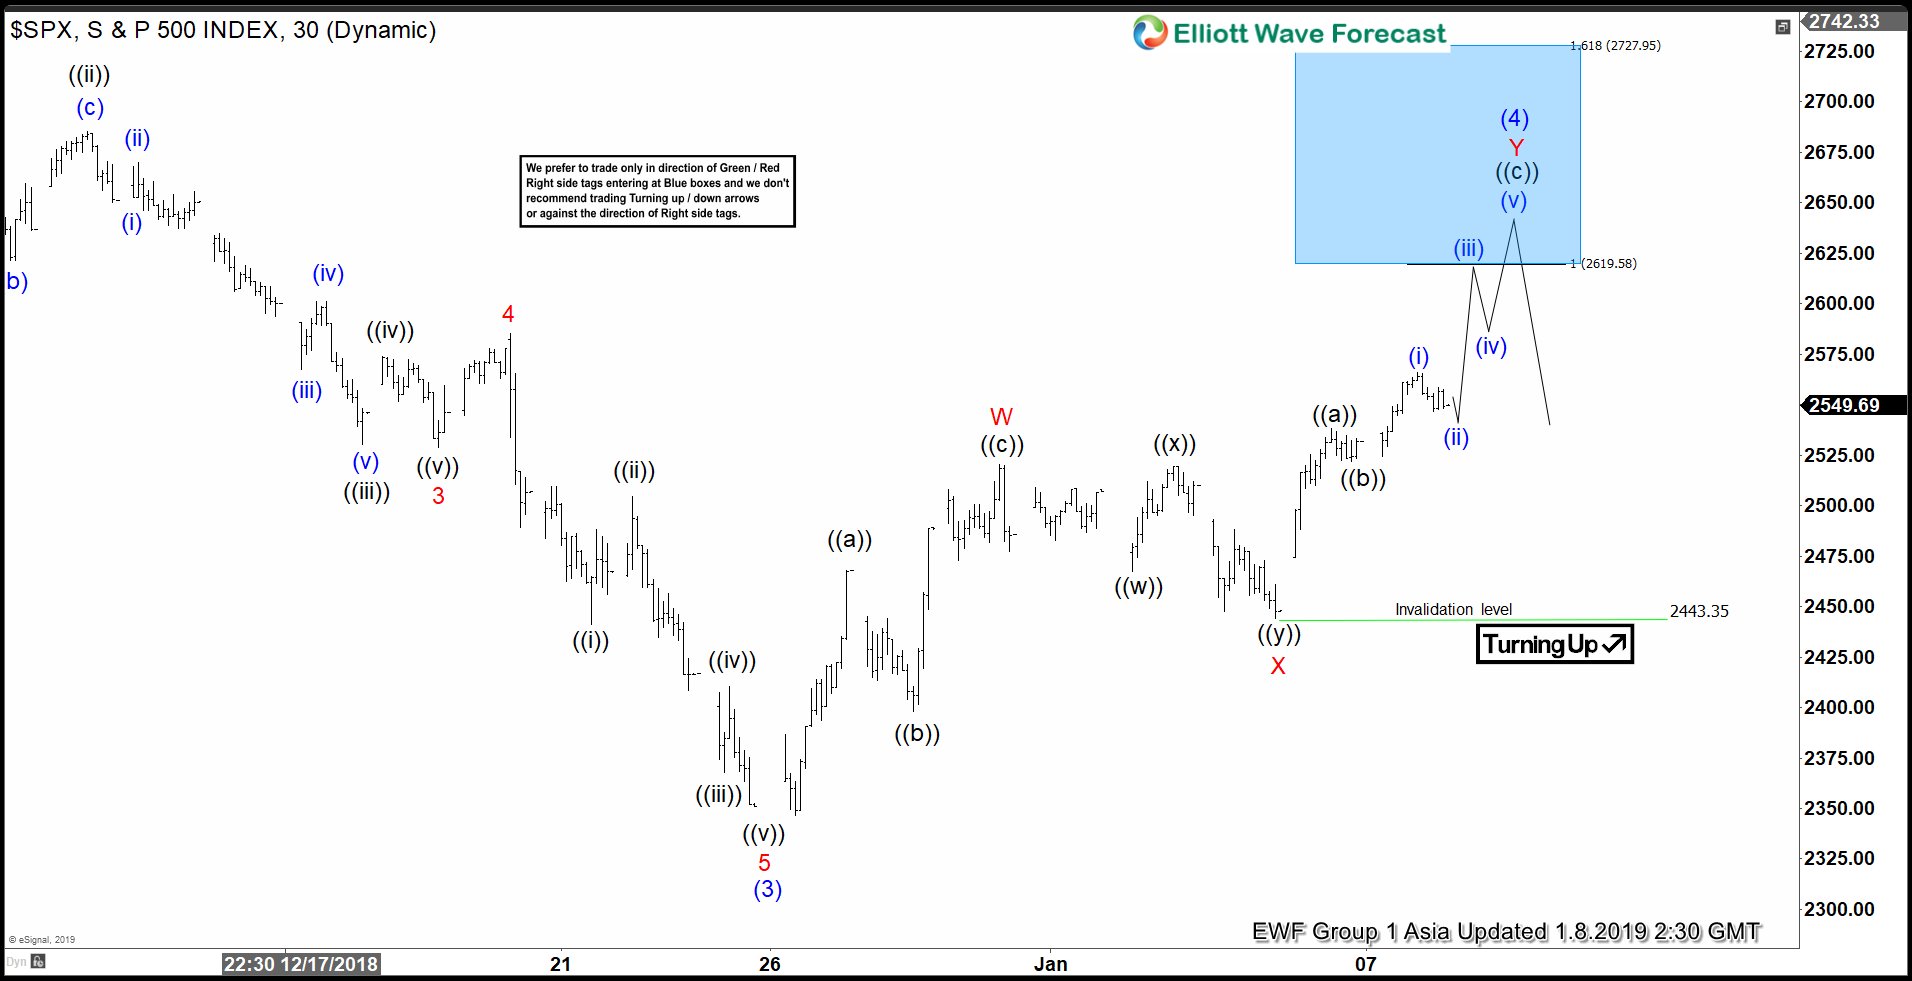
Short term Elliott Wave view in SPX suggests that the decline to 2346.58 ended wave (3). The Index is currently correcting in wave (4) as a double three Elliott Wave structure. Up from 2346.58, wave W ended at 2520.27, wave X ended at 2443.96, and wave Y remains in progress towards 2619.58 – 2727.95 area before Index resumes lower or pullback in 3 waves at least.
A double three Elliott Wave structure is a complex correction in which we have two Elliott Wave corrective structures together. In this case, wave W subdivides as a zigzag Elliott Wave structure where wave ((a)) ended at 2467.76, wave ((b)) ended at 2397.94, and wave ((c)) of W ended at 2520.27. Wave X subdivides as a double three of lesser degree where wave ((w)) ended at 2467.47, wave ((x)) ended at 2519.49, and wave ((y)) ended at 2443.96.
Wave Y is proposed to be unfolding as a zigzag where wave ((a)) ended at 2538.07, wave ((b)) ended at 2522.13, and wave ((c)) of Y is in progress towards 2619.58 – 2727.95 before ending the entire wave (4) correction. Expect sellers to appear once wave (4) correction is over at the blue box area for a 3 waves pullback at least.
SPX 1 Hour Asia Elliott Wave Chart


