After completing the bearish cycle from November 2024 at the extreme of a double three correction, TXN has surged by over 45% from the blue box. This rally is re-establishing the all-time bullish cycle and specifically the cycle from October 2002. Buyers are expected to buy the dip as the upside remains favored.
Texas Instruments (TXN) is a global semiconductor company known for designing and manufacturing analog and embedded processing chips. With products used in everything from industrial equipment to personal electronics, TXN plays a critical role in powering modern technology. Its consistent innovation and strong market presence make it a closely watched stock in the tech sector.
TXN completed a long-term grand supercycle degree wave ((II)) in October 2002. At that low, it barely traded for $13. Meanwhile, the next two decades saw an astronomical rise in the TXN stock prices as the grand supercycle degree wave ((III)) emerged. Wave (I) of ((III)) finished in August 2007 at $39.6. Thereafter, a pullback for wave (II) followed to barely $13.4 in December 2008. Wave (III) started in December 2008 and the stock established a bullish sequence after breaking it’s previous record high $99.8 (March 2000 peak). The stock established new peak at $202.2 in October 2021. At the peak of October 2021, the stock established wave III of (III) of ((III)). Afterwards, it started a pullback for wave IV that lasted till October 2023. However, it would soon rally from that low and established a new high of $220.38 in November 2024.
TXN Elliott Wave Analysis – Daily Chart
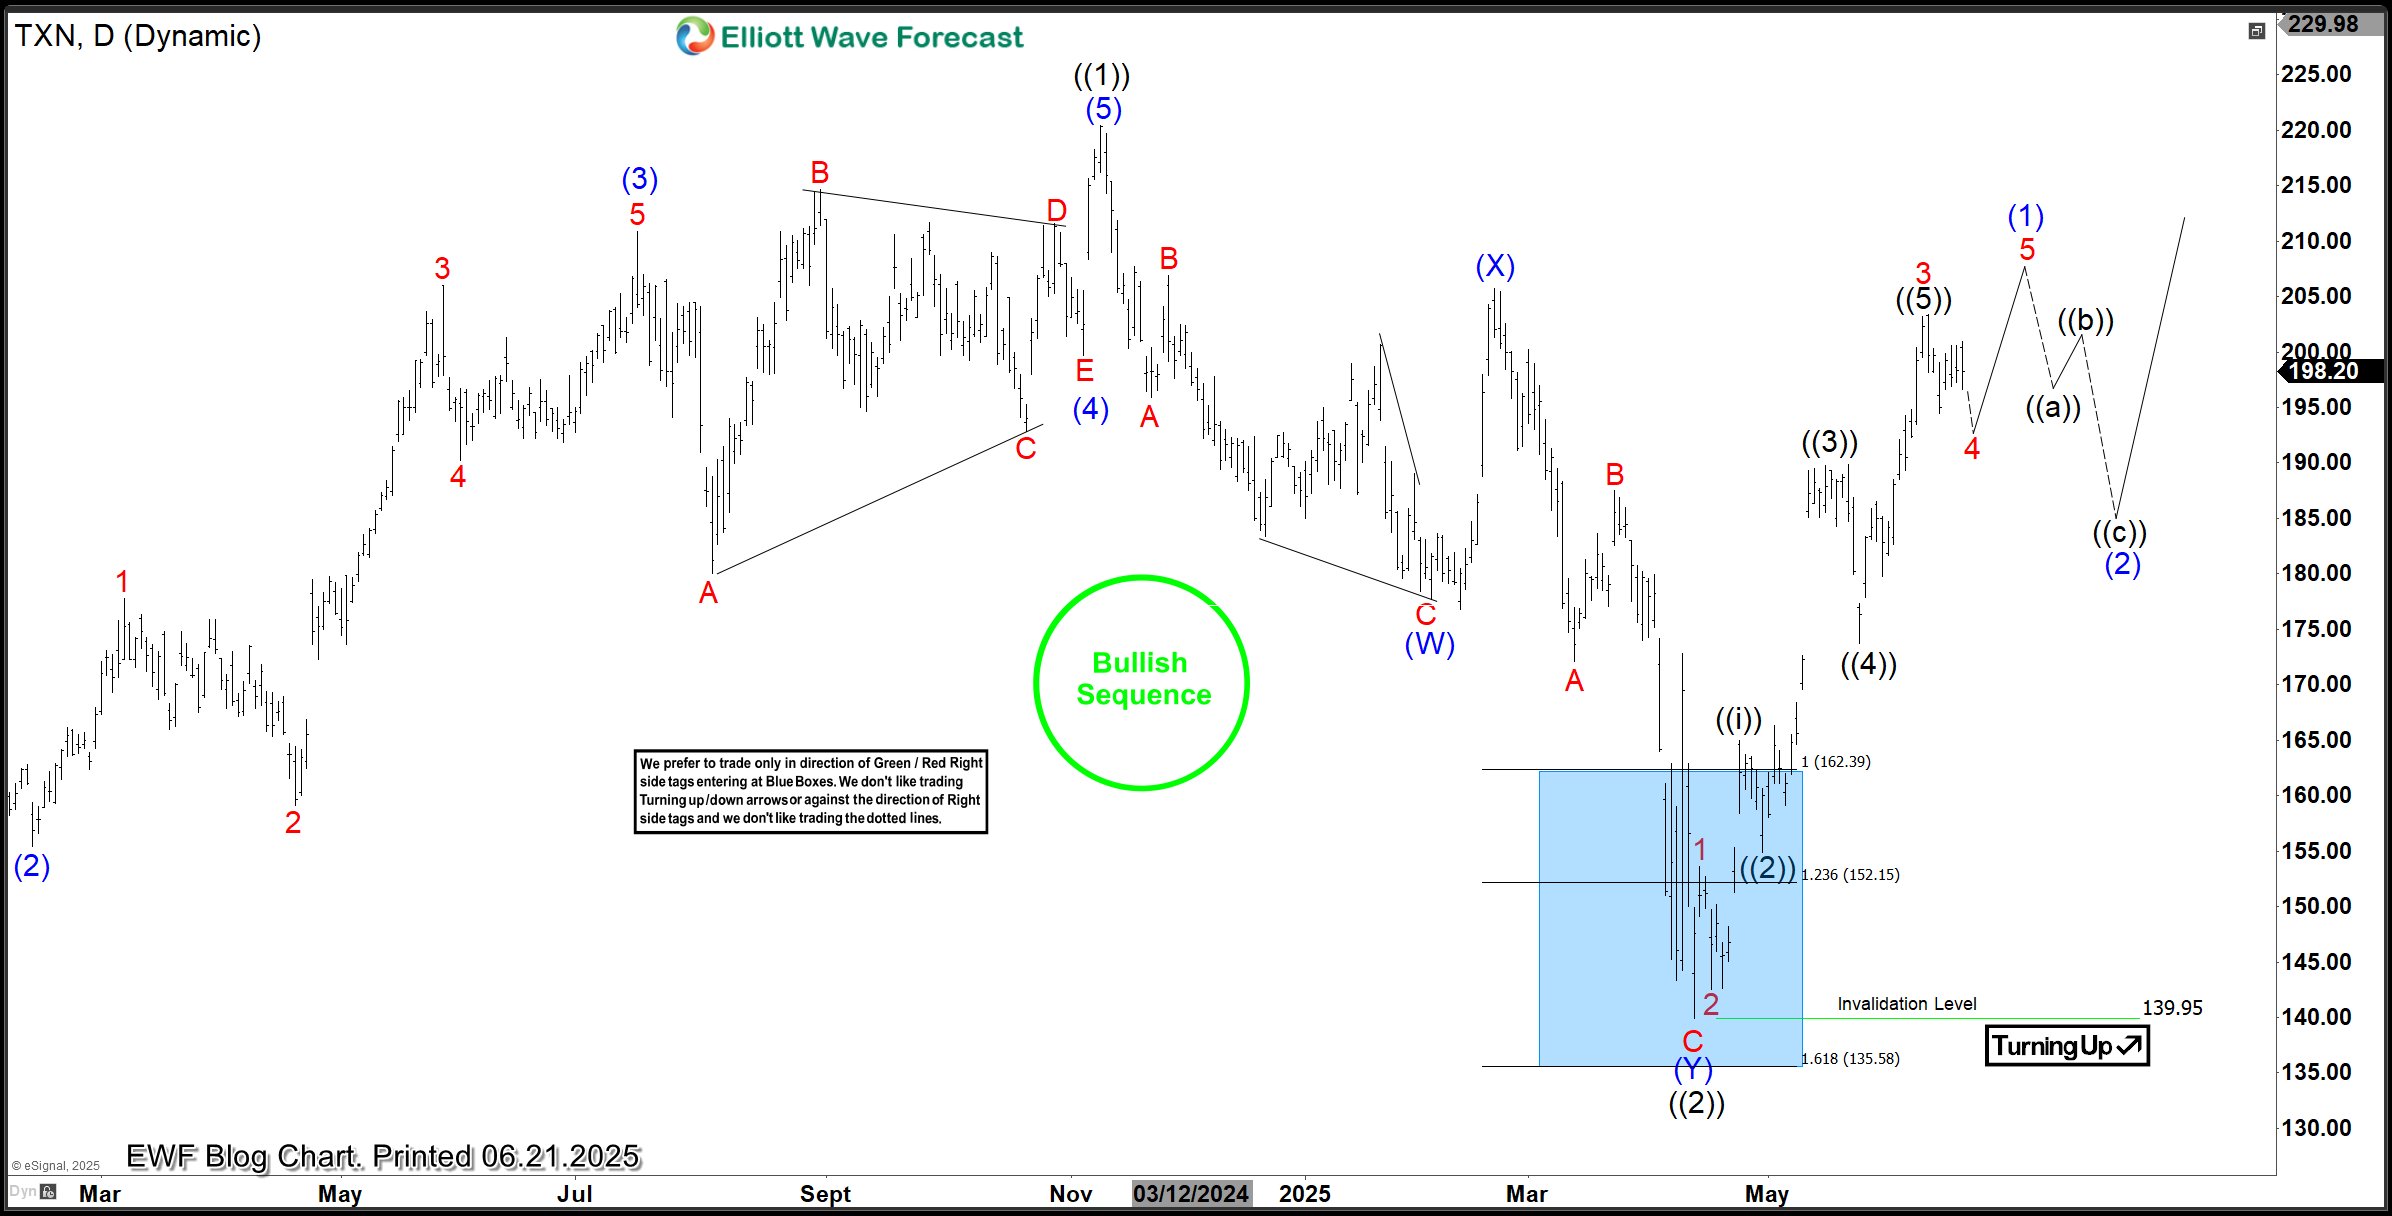
The TXN daily chart above shows the record high of 8th November 2024 as the wave ((1)) of I. Afterwards, a pullback started and completed a 7-swing setup at the blue box. In a bullish sequence, buyers buy at the extreme of a 3/7/11 swing pullback. We identify the extreme with a blue box where we expect the next price pivot to be. The stock went deep into the blue box and then rallied to show completion for wave ((2)). In addition, the response rally from the 139.95 pivot shows an emerging impulse wave structure with an extended 3rd wave. It appears the most recent dip is wave 4 of (1) and may soon finish a double three structure on the shorter cycles before returning upside. With this clear sequence, we will like to remain buyers. The next opportunity for buyers will be at the extreme of wave (2). Eventually, wave ((1)) high will be breached to establish a new record high. Thereafter, buyers should continue to buy 3/7/11 swing pullbacks from the blue box.
Source: https://elliottwave-forecast.com/stock-market/txn-rallies-45-bluebox-bullish-sequence/