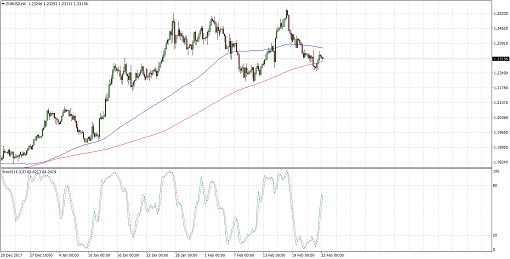
EURUSD could be in for a selloff as a double top pattern can be seen on its 4-hour time frame. Price has yet to break below the neckline at the 1.2200-1.2250 levels before confirming the potential downtrend. The chart pattern is approximately 300 pips tall so the resulting selloff could be of the same height.
The 100 SMA is above the longer-term 200 SMA so the path of least resistance is to the upside, but the gap is narrowing to signal that a downward crossover is due. In that case, bearish momentum could take over soon.
Stochastic is pulling up so price could follow suit. Reaching overbought levels and turning back down could draw more sellers in and sustain the drop.
Euro zone economic data turned out weaker than expected in the previous London session as the German IFO business climate index fell from 117.6 to 115.4. The ECB meeting minutes contained a few hawkish remarks but the central bank’s hesitation to commit to a tightening plan has led to some euro weakness.
Meanwhile, the dollar lost ground to its peers as risk appetite appeared to return to the markets. Bond yields ticked lower while equities and commodities chalked up gains, leaving the safe-haven currency to decline.
Up ahead, FOMC members Dudley, Williams, and Mester have testimonies scheduled so their monetary policy remarks could determine where the dollar might be headed next. Euro zone final CPI readings are also lined up.
By Kate Curtis from Trader’s Way