
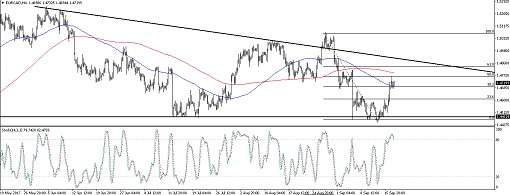
EURCAD is forming a descending triangle on its 4-hour chart and could be due for a test of the top. This lines up with the 61.8% Fibonacci retracement level near the 1.4850 minor psychological mark and a former support zone.
The 100 SMA is below the longer-term 200 SMA so the path of least resistance is to the downside. This means that the resistance is more likely to hold than to break. Price is currently testing the 100 SMA dynamic resistance but may still have some momentum left to test the 200 SMA dynamic inflection point.
Stochastic is already indicating overbought conditions and is starting to turn lower to show a return in selling pressure. If any of the Fibs are able to keep gains in check, price could fall back to support around the 1.4500 handle.
The main event risks for this trade are the Canadian retail sales and CPI releases on Friday. Analysts are expecting to see a 0.2% increase in headline retail sales, faster than the earlier 0.1% uptick, and a 0.4% gain in the core version of the report. Headline CPI is projected to come in at 0.2% after staying flat in the previous month.
As for the euro, volatility could also kick higher towards the end of the week with a couple of speeches by Draghi and the PMI readings from its top economies. ECB officials have been trying to talk down the shared currency, wary of spurring more gains on speculations of ECB tapering.
If Draghi emphasizes the challenges posed by a stronger euro, the shared currency could give up more of its recent gains. On the other hand, focusing on the improvements in the region and giving more clues on what their next policy moves might be could keep it supported.
By Kate Curtis from Trader’s Way