
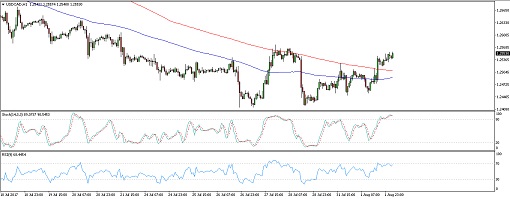
USDCAD failed in its last two attempts to break below the 1.2400 area, creating a double bottom formation on its 1-hour time frame. Price has yet to break past the neckline at 1.2575 before confirming the potential reversal.
The chart pattern is around 175 pips tall so the resulting rally could be of the same size. The 100 SMA is below the longer-term 200 SMA so the path of least resistance is to the downside for now, but the gap is narrowing to signal that an upward crossover might take place soon.
Stochastic is already indicating overbought conditions, which suggests that buyers might want to take a break and let sellers take over. In that case, USDCAD could head back down to form another bottom near 1.2400. RSI is still pointing up so there’s some buying pressure left.
Economic data from the US turned out mostly in line with estimates. The ISM manufacturing PMI fell from 57.8 to 56.3, slightly weaker than the 56.4 consensus. Most of the components chalked up declines while the prices component surged from 55 to 62.
The API report printed a surprise buildup in crude oil stockpiles instead of the projected draw, leading some to speculate that oversupply troubles may be back and that the EIA might report an increase in inventory as well. Underlying inflation figures from Canada have been weaker than expected while the manufacturing PMI showed a faster pace of industry growth.
By Kate Curtis from Trader’s Way