Relative Strength Index (RSI), one of the most popular financial technical analysis oscillators is best adapted to work in markets, which is range-bound. Developed in 1978 by J.Welles Wilder its popularity is mainly due to its easy interpretation.
RSI helps you measures the strength of all upward movement against the strength of all downward movement in a specific period. Even though the common parameter for RSI period is 14, because, Wilder recommended a smoothing period of 14; users can however choose the period of their choice.
The RSI compares the upward price movement to downward price movement over the specified timeframe, and displays the result as a momentum line oscillating between 0 and 100.

Moreover, relative strength index or RSI can range from zero to hundred, which is a result displayed as a momentum line oscillation. If someone tells you that the RSI is 50, it means that the market is demonstrating an equal strength of upward and downward force. Similarly if RSI is greater than 50 that denotes a strong upward force than the downward force; while, less than 50 denotes a stronger downward force in comparison to the upward force.
To make the process simpler, here is a mathematical representation of RSI:
RSI = 100 – [100/ (1+RS)]
Relative Strength = Average of ‘n’ day’s up closes / Average of ‘n’ day’s down closes
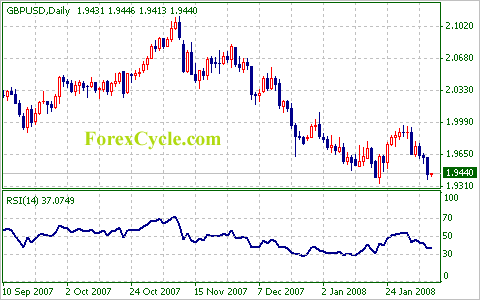
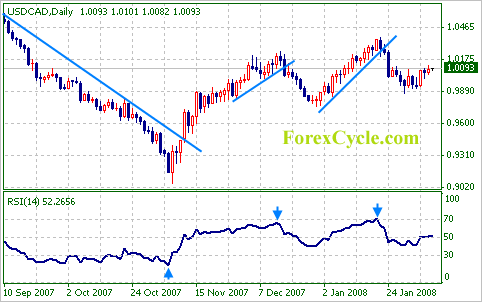
A number of applications use relative strength index like, for detecting the overbought and oversold condition of the market and spot divergence; where, it has been successfully implemented. Just like as considered by Wilder, if RSI is less than 30, the market/security is deemed oversold, an investor should consider buying; similarly, if RSI is greater than 70, the market/security is deemed to be overbought, and an investor should consider selling.

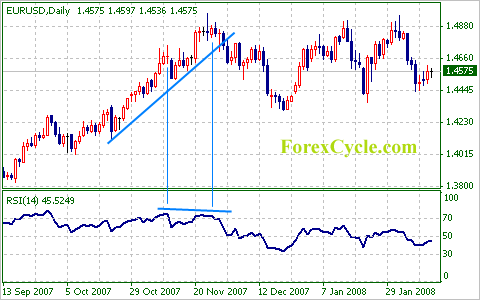
So also is the application of RSI in Spot divergence. Divergences are a universal form of interpretation for the Relative Strength Index. When the relative strength index starts diverging and moving in a different direction along with the value near support/resistance level, it indicates the dwindling of the market trend. This is said to have accomplished a “failure swing” and therefore is confirmed the coming reversal.

The use of relative strength index is the most appropriate as a valuable complement to other stock-picking tools. It is imperative that a trader should understand the technicalities of using RSI. He/She should also be aware that big surges and drops in the asset price would affect the RSI by creating false buy or sell signals.
Moreover, there is a strong connection between relative strength index and momentum. If the specified momentum period is greater than one, then this period definitely becomes the model period for comparing closes to resolve gains and losses.
Supposedly, if seven is the momentum period, then you may compare the current close to the close seven periods ago. In case the relative strength index using a momentum period is greater than one, then you can refer to it as Relative Momentum Index (RMI).

