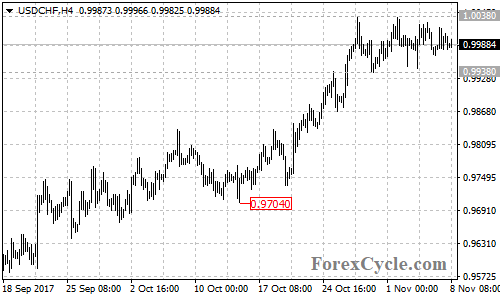
The USDCHF pair moved sideways in a narrow range between 0.9938 and 1.0038 on the 4-hour chart for several days. As long as the price is above 0.9938 support, the sideways move could be treated as consolidation of the uptrend from 0.9704, and further rise is still possible after the consolidation.
On the upside, the USDCHF pair traded in a bullish price channel on its daily chart. As long as the price is in the channel, the bullish movement could be expected to continue and a breakout of 1.0038 resistance could signal resumption of the uptrend from 0.9704, then next target would be at the April 10 high of 1.0108. Above this level could trigger further upside movement towards the March 7 high of 1.0170.
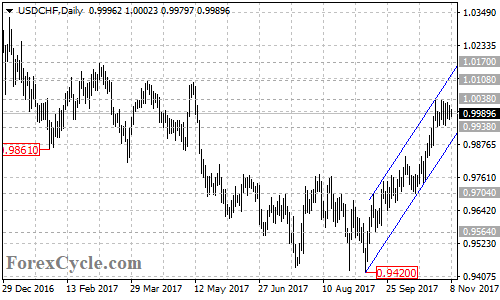
On the downside, a breakdown below 0.9938 support will suggest that lengthier consolidation for the longer term uptrend from 0.9402 is underway, then deeper decline towards bottom support trend line of the price channel now at 0.9890 could be seen. A clear break below the channel support will indicate that the uptrend from 0.9420 had completed at 1.0038 already, then the pair would find next support level at 0.9850, followed by the October 13 low of 0.9704.
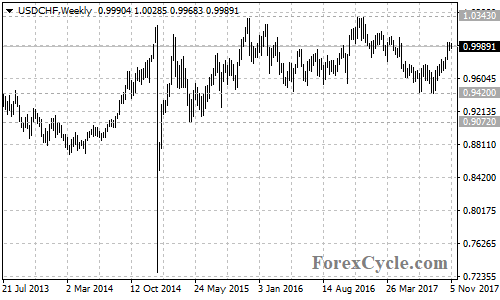
For long term analysis, the USDCHF pair formed a sideways movement in a trading range between 0.9420 and 1.0343 on the weekly chart. Another rise towards 1.0343 resistance would likely be seen over the next several weeks.
Technical levels
Support levels: 0.9938, 0.9890, 0.9850, 0.9704, 0.9564, 0.9420.
Resistance levels: 1.0038, 1.0108, 1.0170, 1.0343.