
EURGBP recently broke below the bullish trend line at 0.9050 on its daily chart. The subsequent fall had taken price to as low as 0.8866, indicating that the upside movement from 0.8313 had completed at 0.9306 already.
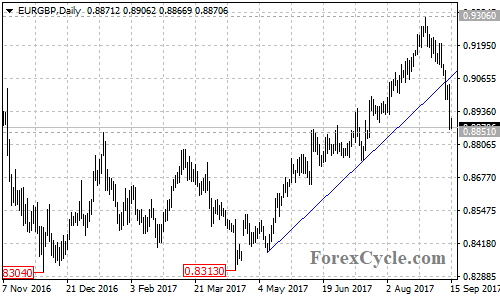
The pair is now facing a resistance-turned-support level at the January 16 high of 0.8851. A breakdown below this level could bring price to next support level at the 61.8% Fibonacci retracement taken from 0.8313 to 0.9306 at around 0.8690, followed by the 76.4% retracement at 0.8545.
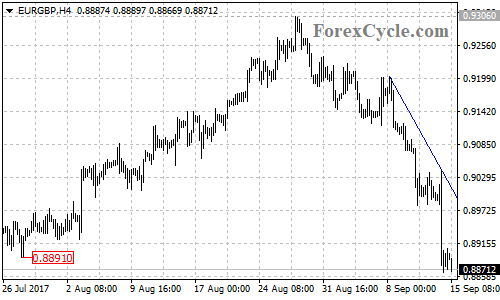
On the 4-hour chart, the EURGBP pair stays below a bearish trend line now at 0.9010. As long as the price is below the trend line, the downside movement from 0.9306 will continue. However, a clear break above the trend line resistance would suggest that the bearish movement is complete, then the correction rebound could take price back into 0.9140 zone.
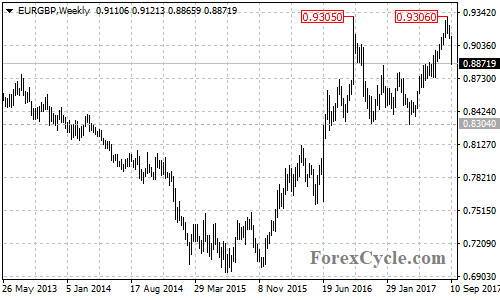
For long term analysis, EURGBP might be forming a double top pattern on its weekly chart, with neckline at the December 2016 low of 0.8304. A breakdown below the neckline support could confirm the pattern, then the measured move target would be at 0.7300.
Technical levels
Support levels: 0.8851 (the January 16 high), 0.8690 (the 61.8% Fibonacci retracement), 0.8545 (the 76.4% Fibonacci retracement), 0.8304 (the neckline of the double top pattern), 0.7300 (the measured move target).
Resistance levels: 0.9010 (the bearish trend line on the 4-hour chart), 0.9140, 0.9306 (the August 29 high).