Hello traders. In this technical article we’re going to take a quick look at the Elliott Wave charts of FTSE Index published in members area of the website.
As our members know, FTSE made a pullback that unfolded as an Elliott Wave Zig Zag pattern. Price completed a clear 3-wave move down from the peak and found support at the Equal Legs zone (buying area).
In the following analysis, we explain the Elliott Wave pattern and the market outlook.
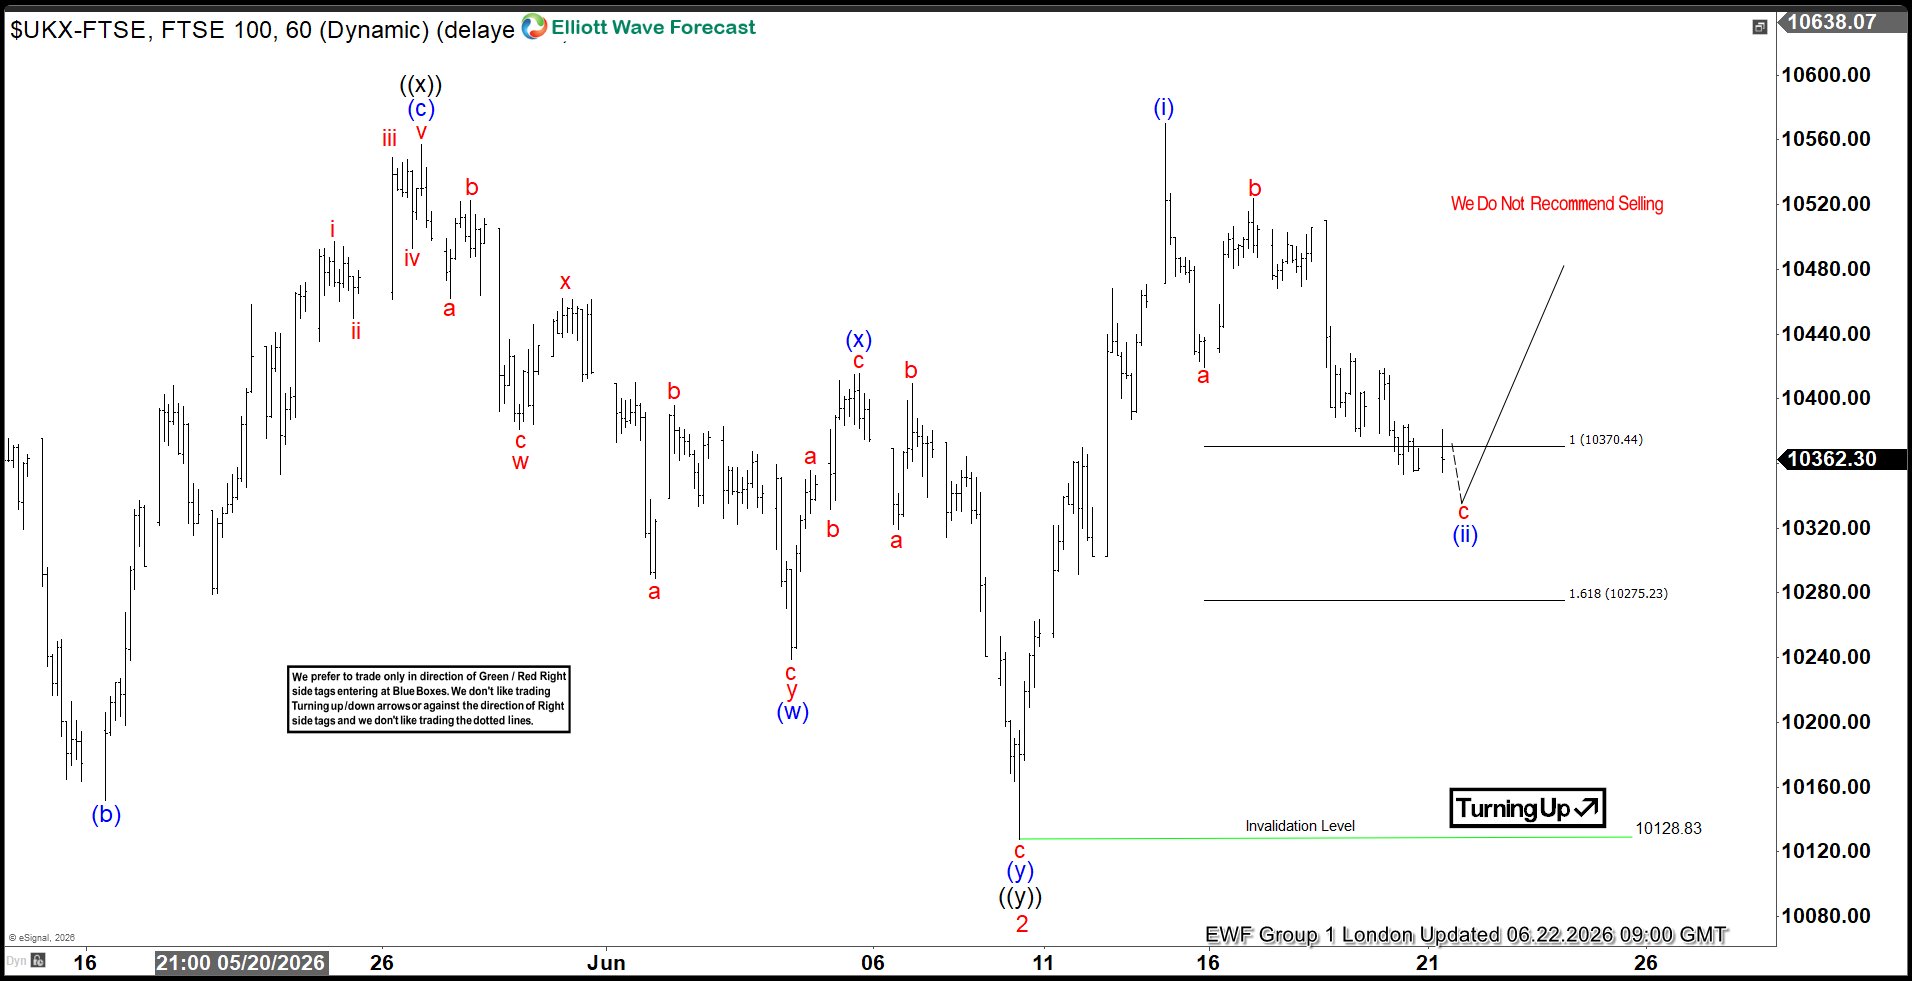
FTSE Elliott Wave 1 Hour Chart 06.22.2026
FTSE is currently forming an intraday three-wave pullback from recent highs. We identified a buying zone by measuring the Equal Legs area using the Fibonacci extension tool, with a projected relative to b. The ideal support area comes in at 10370.44-10275.23. The correction is not complete yet, and the index could see more downside in the near term within the marked buying zone. As long as price holds within this region, we expect buyers to step in and the rally to resume toward new highs.
You can learn more about Elliott Wave Patterns at our Free Elliott Wave Educational Web Page
90% of traders fail because they don’t understand market patterns. Are you in the top 10%? Test yourself with this advanced Elliott Wave Test
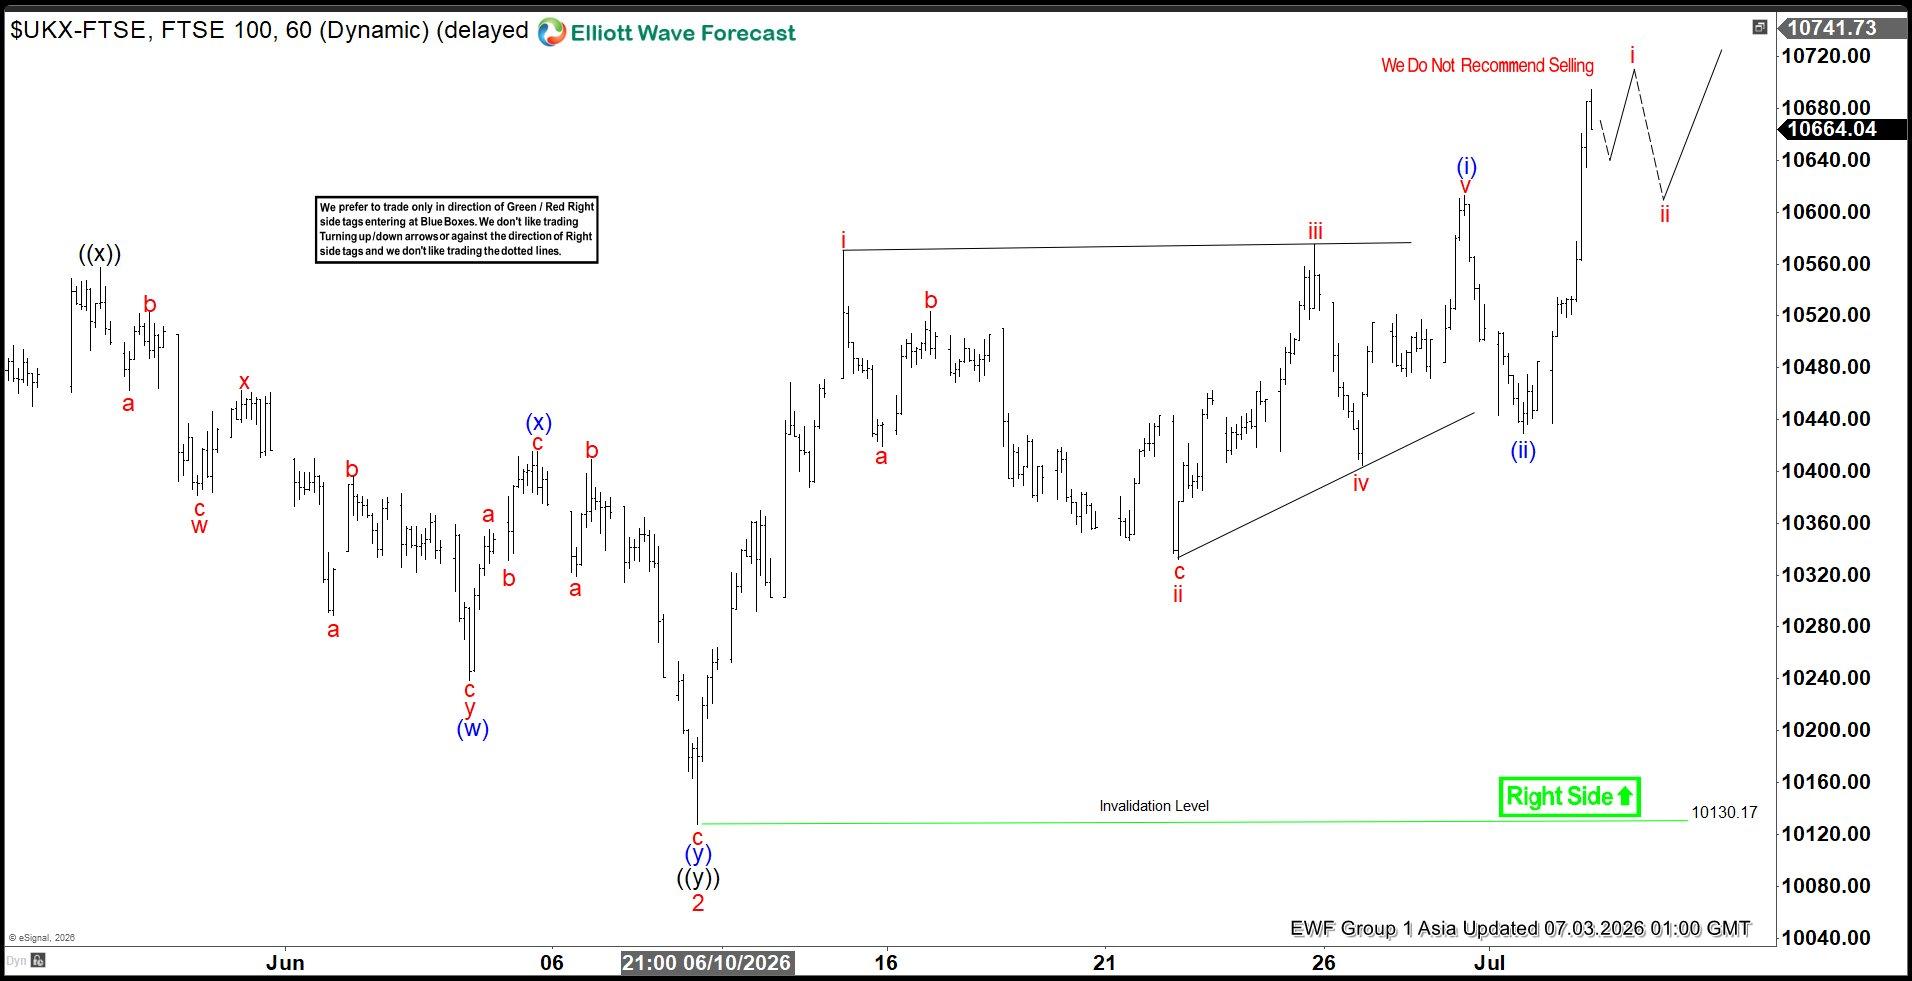
FTSE Elliott Wave 1 Hour Chart 07.03.2026
The Index has found buyers at the Equal Legs zone , just as expected. The correction ended at the 10333.17 low, and since then, FTSE is giving us a rally. As a result, any long positions from the equal legs zone are now risk-free.
Important note: Our analysis is not based on Elliott Wave in isolation. We perform detailed higher-time-frame cycle analysis, which shows an incomplete market structure. This is one of the key drivers of price action, along with correlation analysis and broader market context.
We also teach our members in live analysis sessions how to identify incomplete bullish and bearish sequences. Even a 14-day trial, is enough to noticeably improve your trading analysis and forecasting approach.