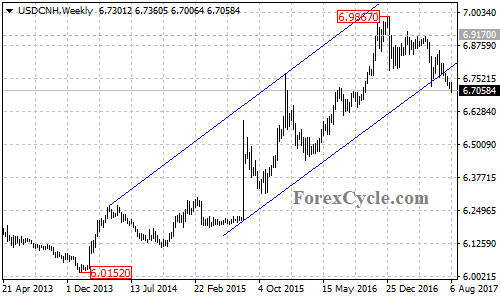
USDCNH extended its bearish movement from 6.9867 to as low as 6.7006, breaking below the bottom support trend of the price channel at 6.7740 on its weekly chart, suggesting that the long term uptrend from the January 2014 low of 6.0152 had completed at the January 3 high of 6.9867 already. Correction pullback could be expected to continue over the next several weeks.
On the 4-hour chart, there is a bearish trend line with resistance now at around 6.7320. As long as the USDCNH pair is below the trend line, the bearish movement from 6.8111 could be expected to continue and next target would be at 6.6650 area, followed by the 38.2% Fibonacci support taken from 6.0152 to 6.9867 at around 6.6150.
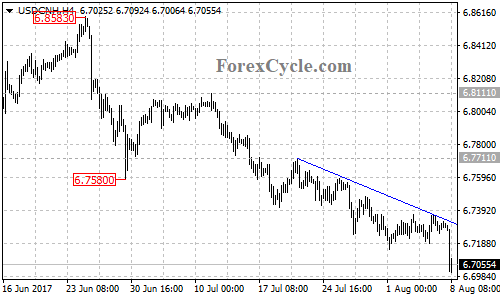
On the upside, a clear break above the bearish trend on the 4-hour chart will indicate that the short term downtrend from 6.8111 is complete, then the following upside move could bring price back to the support-turned-resistance level at the June 30 low of 6.7580. A break of this level could trigger another rise into 6.8450 zone.
Technical levels
Support levels: 6.6650 (the near term support), 6.6150 (the 38.2% Fibonacci support).
Resistance levels: 6.7320 (the bearish trend line on the 4-hour chart), 6.7580 (support-turned-resistance), 6.8111 (the July 11 high), 6.8588 (the June 26 high), 6.9170 (the key resistance on the daily chart), 6.9867 (the January 3 high), 7.0000 (the important psychological level).