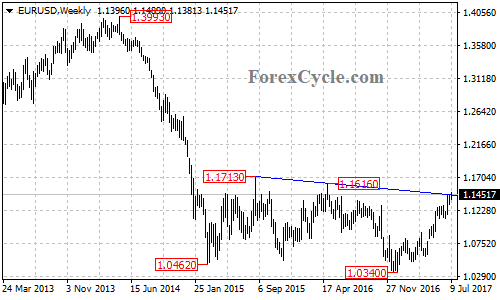
There is a descending trend line from the August 2015 high of 1.1713 to the May 2016 high of 1.1616, with resistance at around 1.1450, acting as the neckline of the double bottom pattern on the EURUSD’s weekly chart. If the price breaks and settles above the trend line resistance, it would confirm pattern, then the price could extend to the measured move target at around 1.2700.
On the daily chart, the EURUSD pair ran above a bullish trend line with support at around 1.1300, and remains in the uptrend from 1.0569. As long as the pair is above the trend line, the bullish movement could be expected to continue. A clear break above 1.1450 level could take price to the next resistance level at 1.1713, above this level could pave the way for the long term bullish move towards 1.2700.
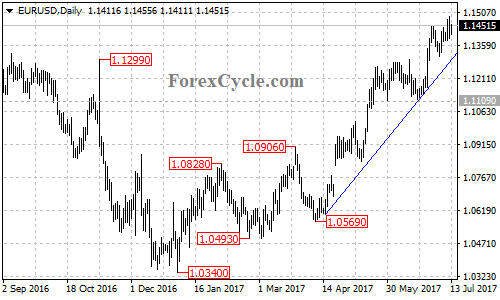
On the downside, a breakdown below the trend line on the daily chart could bring price back to test 1.1109 key support. Below this level will indicate that lengthier consolidation for the uptrend from 1.0340 is underway, then the pair will find next support level at around 1.0950, only break below this level could signal completion of the uptrend.
Technical levels
Support levels: 1.1300 (the bullish trend line on the daily chart), 1.1109 (the May 30 low), 1.0950.
Resistance levels: 1.0450 (the neckline on the weekly chart), 1.1616 (the May 2016 high), 1.1713 (the August 2015 high), 1.2700 (measured move target).