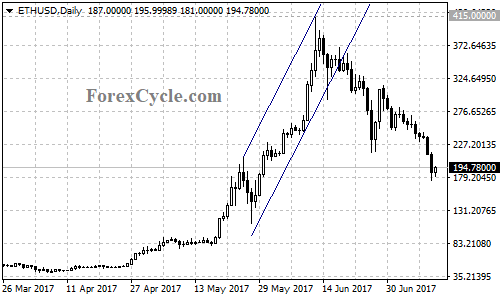
After hitting a highest record at 415, ETHUSD broke below the bullish price channel on its daily chart and fell sharply to as low as 175.50. Will the Ethereum crash continue?
Let’s look into its 4-hour chart, the Ethereum stays below a bearish trend line from the June 12 high of 415 to the June 29 high of 314.80 with resistance at around 234. As long as the price is below the trend line, we would expect the downtrend to continue, and further decline to test the support of the 61.8% Fibonacci retracement taken from 0 to 415 at around 156 is possible in the coming days. A breakdown below this level could take price to the next support level of the 20-week moving average at around 135.
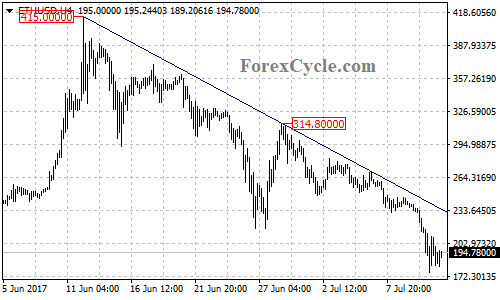
Near term resistance is at 210, a break of this level could bring price back to the bearish trend line on the 4-hour chart. The key resistance is located at the trend line, if the price breaks and settles above the trend line resistance, it would confirm that the downtrend from 415 is complete, then following upside movement could bring price back to the next resistance level of 314.80.
For long term analysis, the fall from 415 would possibly be correction of the long term uptrend and a clear break above the bearish trend line could signal resumption of the uptrend.
Technical levels
Support levels: 156 (the 61.8% Fibonacci retracement), 135 (the 20-week moving average).
Resistance levels: 210 (near term resistance), 234 (the bearish trend line on the 4-hour chart), 314.80 (the June 29 high), 415 (the June 12 high).