
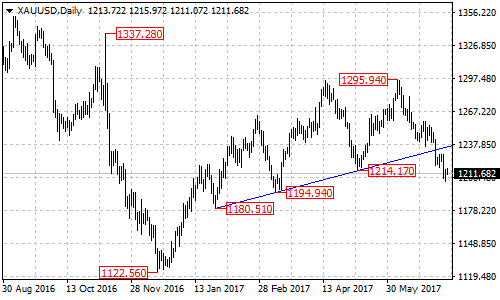
After breaking below the major support trend line from the January 27 low of 1180.51 to the May 9 low of 1214.17 on its daily chart, XAUUSD continued to break below the key support at 1214.17, confirming that the uptrend from the December 2016 low of 1122.56 had completed at the June 6 high of 1295.94 already.
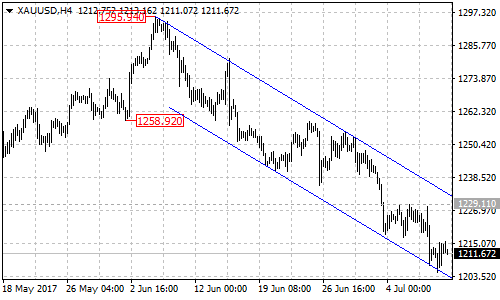
Let’s look into its 4-hour chart. Gold price ran in a bearish price channel with resistance at its top trend line at around 1232.90. As long as the price is in the channel, the bearish movement could be expected to continue and next target would be at 1185, followed by 1165.
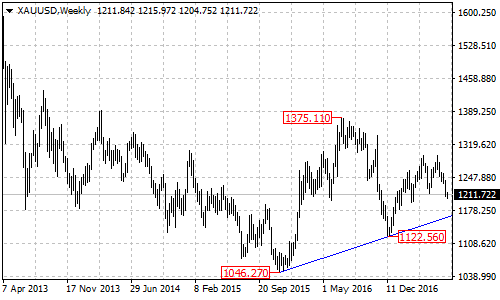
As discussed before, there is an ascending trend line from the November 2015 low of 1046.27 to 1122.56 with support at around 1165 on its weekly chart, which would become the final target of the current bearish movement. Strong rebound could be expected after touching this trend line support.
Near term resistance is at 1229.11, followed by the top of the price channel on the 4-hour chart now at around 1232.90. Only break above these levels will indicate that the downtrend from 1295.94 is complete, then the following upside movement could bring price back into 1300 zone.
Technical levels
Support levels: 1180.51 (the January 27 low), 1165 (the trend line support on the weekly chart), 1122.56 (the December 2016 low).
Resistance levels: 1229.11 (near term resistance), 1232.90 (the top trend line of the price channel on the 4-hour chart), 1300 (the important psychological level).