
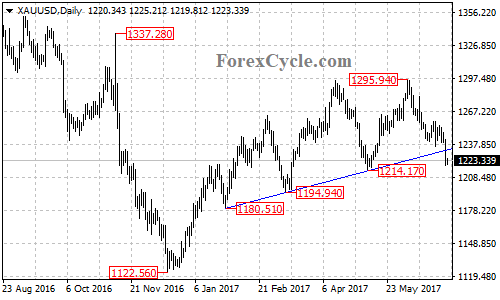
XAUUSD’s downside movement from the June 6 high of 1295.94 extended to as low as 1218.45, breaking below the major support trend line from the January 27 low of 1180.51 to the May 9 low of 1214.17 at 1232 on its daily chart. Gold price is now facing another key support at 1214.17.
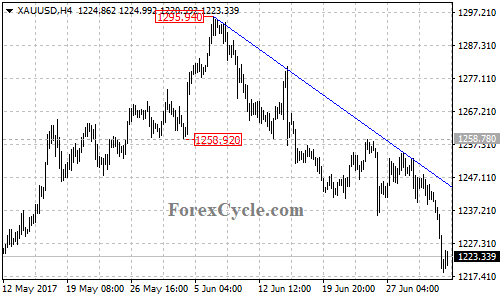
Gold price stays below a bearish trend line with resistance at around 1245 on its 4-hour chart and remains in the downtrend from 1295.94. As long as the price is below the trend line, the bearish movement could be expected to continue and deeper decline to test 1214.17 key support is possible. A breakdown below this level will confirm that the uptrend from the December 2016 low of 1122.56 had completed at 1295.94 already, then the following bearish movement could bring price into 1165 zone.
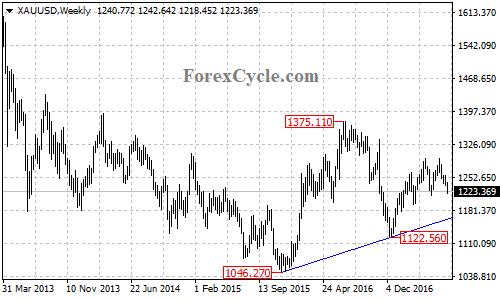
There is another support trend line from the November 2015 low of 1046.27 to 1122.56 with support at around 1165 on its weekly chart. Strong rebound could be expected after touching this trend line support.
On the upside, a clear break above the descending trend line on its 4-hour chart will take price to the key resistance level at 1258.78, above this level will indicate that the short term downtrend from 1295.94 is complete, this could trigger another rise towards 1300.
Technical levels
Support levels: 1214.17 (the May 9 low), 1180.51 (the January 27 low), 1165 (the trend line support on weekly chart), 1122.56 (the December 2016 low).
Resistance levels: 1245 (trend line resistance on 4-hour chart), 1258.78 (key resistance), 1300 (the important psychological level).