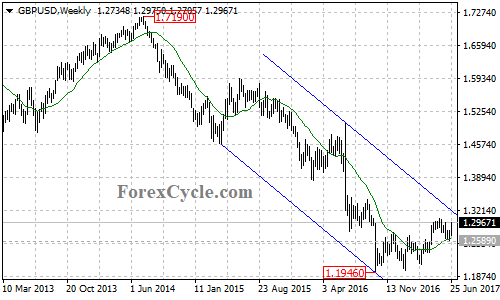
Being supported by the 20-weekly moving average on its weekly chart, the GBPUSD pair rebounded from 1.2589, suggesting that lengthier consolidation for the long term downtrend from the July 2014 high of 1.7190 is needed.
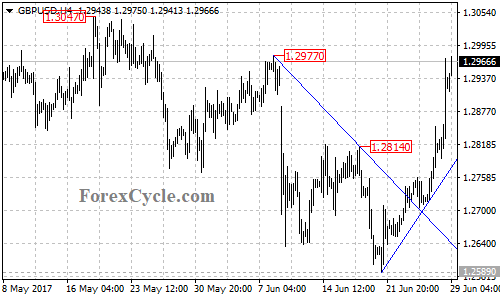
Let’s look into its 4-hour chart chart. The pair recently moved above a major trend line from 1.2977 to 1.2814 at 1.2725 and bounced to as high as 1.2975. There is also a rising trend line with support at around 1.2775. As long as the pair is above the rising trend line, the bullish movement from 1.2589 could be expected to continue, and further rise to test the May 18 high of 1.3047 resistance is possible. A break of this level could take price to the top resistance trend line of the price channel on the weekly chart, now at around 1.3200.
The key resistance for the long term downtrend from 1.7190 is located at the 38.2% Fibonacci retracement taken from the July 2014 high of 1.7190 to the October 2016 low of 1.1946 at around 1.3950. As long as this level holds, the bounce from 1.1946 could be treated as consolidation of the downtrend from 1.7190, and another fall towards 1.1000 is still possible after the consolidation.
The near term key support is at the rising trend line on the 4-hour chart. Only a clear break below the trend line support will confirm that the short term uptrend from 1.2589 is complete, this could trigger another fall towards 1.2000.
Technical levels
Support levels: 1.2775 (the rising trend line on 4-hour chart), 1.2589 (June 21 low), 1.2109 (the March 14 low), 1.1946 (the October 2016 low).
Resistance levels: 1.3047 (the May 18 high), 1.3200 (the top trend line of the price channel on weekly chart), 1.3950 (the 38.2% Fibonacci retracement).