
Platinum (PL) surged to fresh record highs in late January, marking a potential inflection point toward a long‑term secular bull market. This article explores the metal’s extended outlook and the evolving Elliott Wave framework that underpins its advance.
Platinum (PL) Monthly Elliott Wave Chart
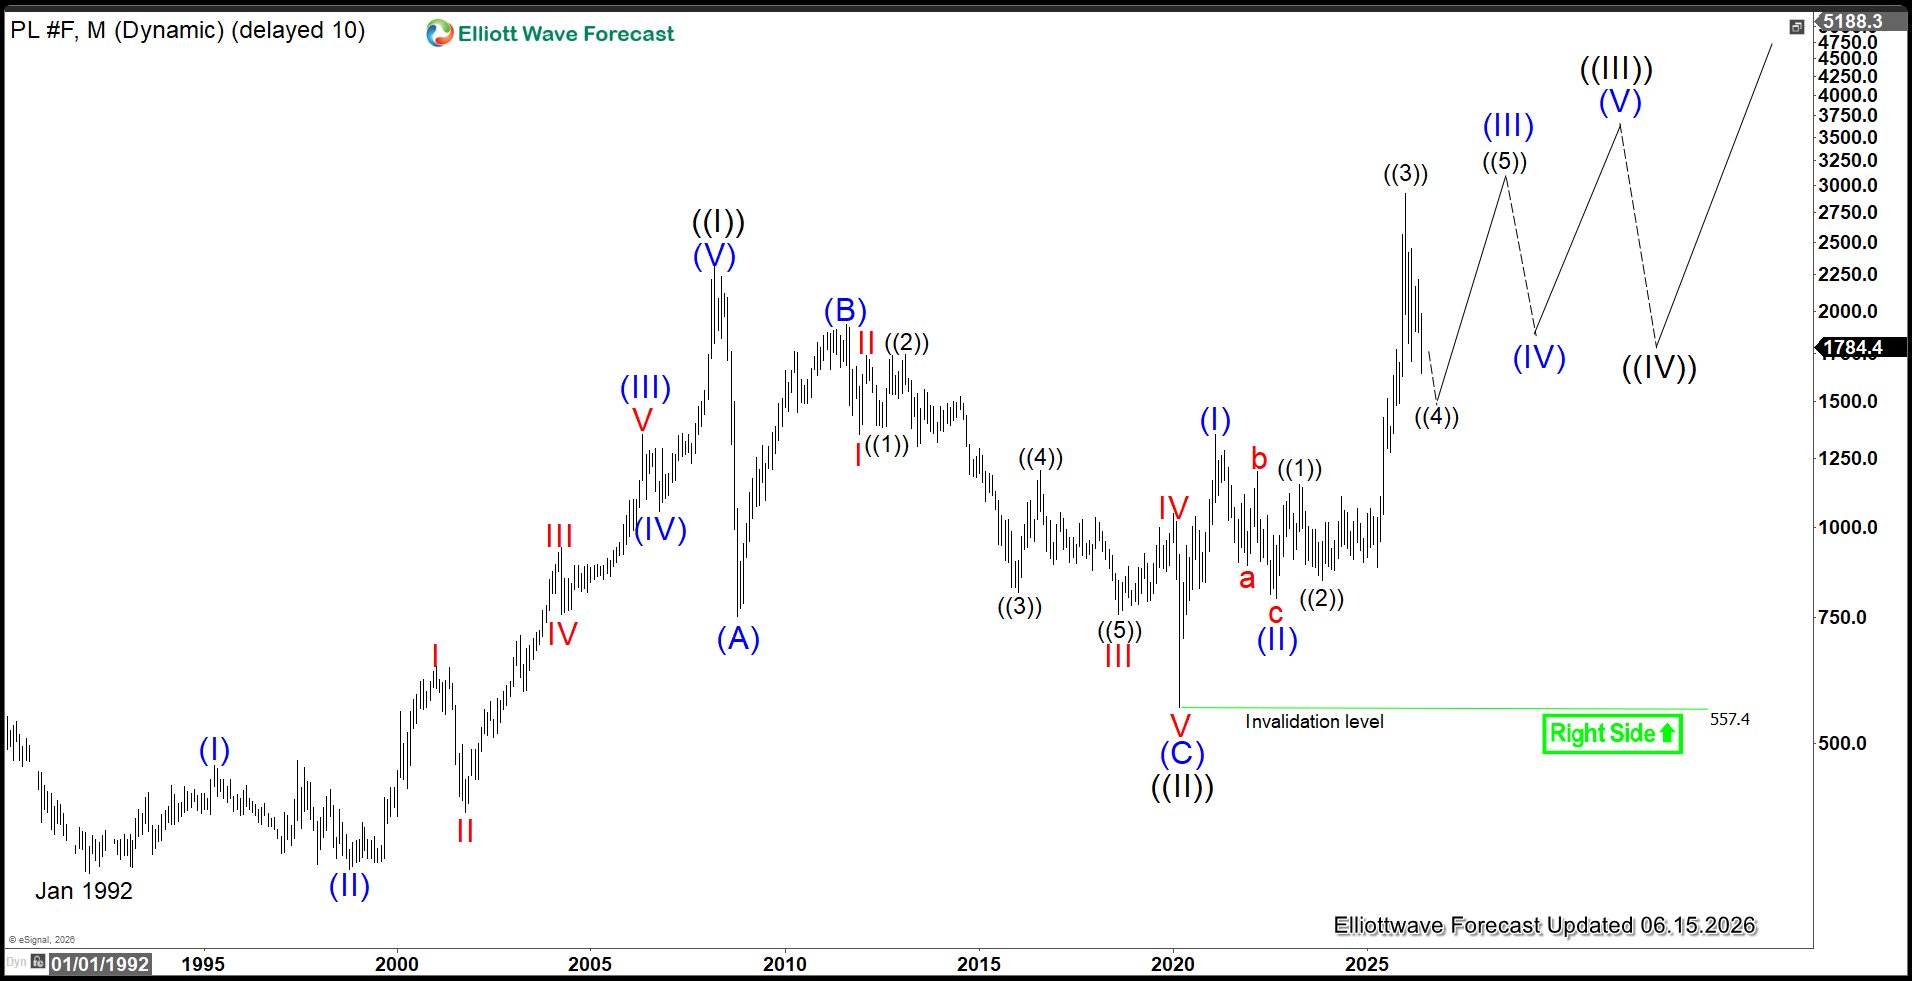
The monthly Platinum chart highlights a decisive breakout into record territory, underscoring the strength of its long‑term bullish trend. The metal continues to track within a secular advance that began decades ago. The rally from January 1992 through the March 2008 peak established wave ((I)) at 2308.8, followed by a sharp zigzag correction down to 557, completing wave ((II)). From that base, Platinum resumed higher and has now extended into fresh highs with a clear impulsive profile.
From the wave ((II)) low, wave (I) terminated at 1348.2, while the subsequent retracement in wave (II) found support at 796.8. The advance in wave (III) unfolded into a five‑wave sequence of lesser degree. Within this structure, wave ((1)) topped at 1148.9, and the corrective dip in wave ((2)) ended at 843.1. Wave ((3)) is proposed complete at 2925. Current action reflects a pullback in wave ((4)), which still has room to extend lower before the broader uptrend resumes.
Platinum (PL) Daily Elliott Wave Chart
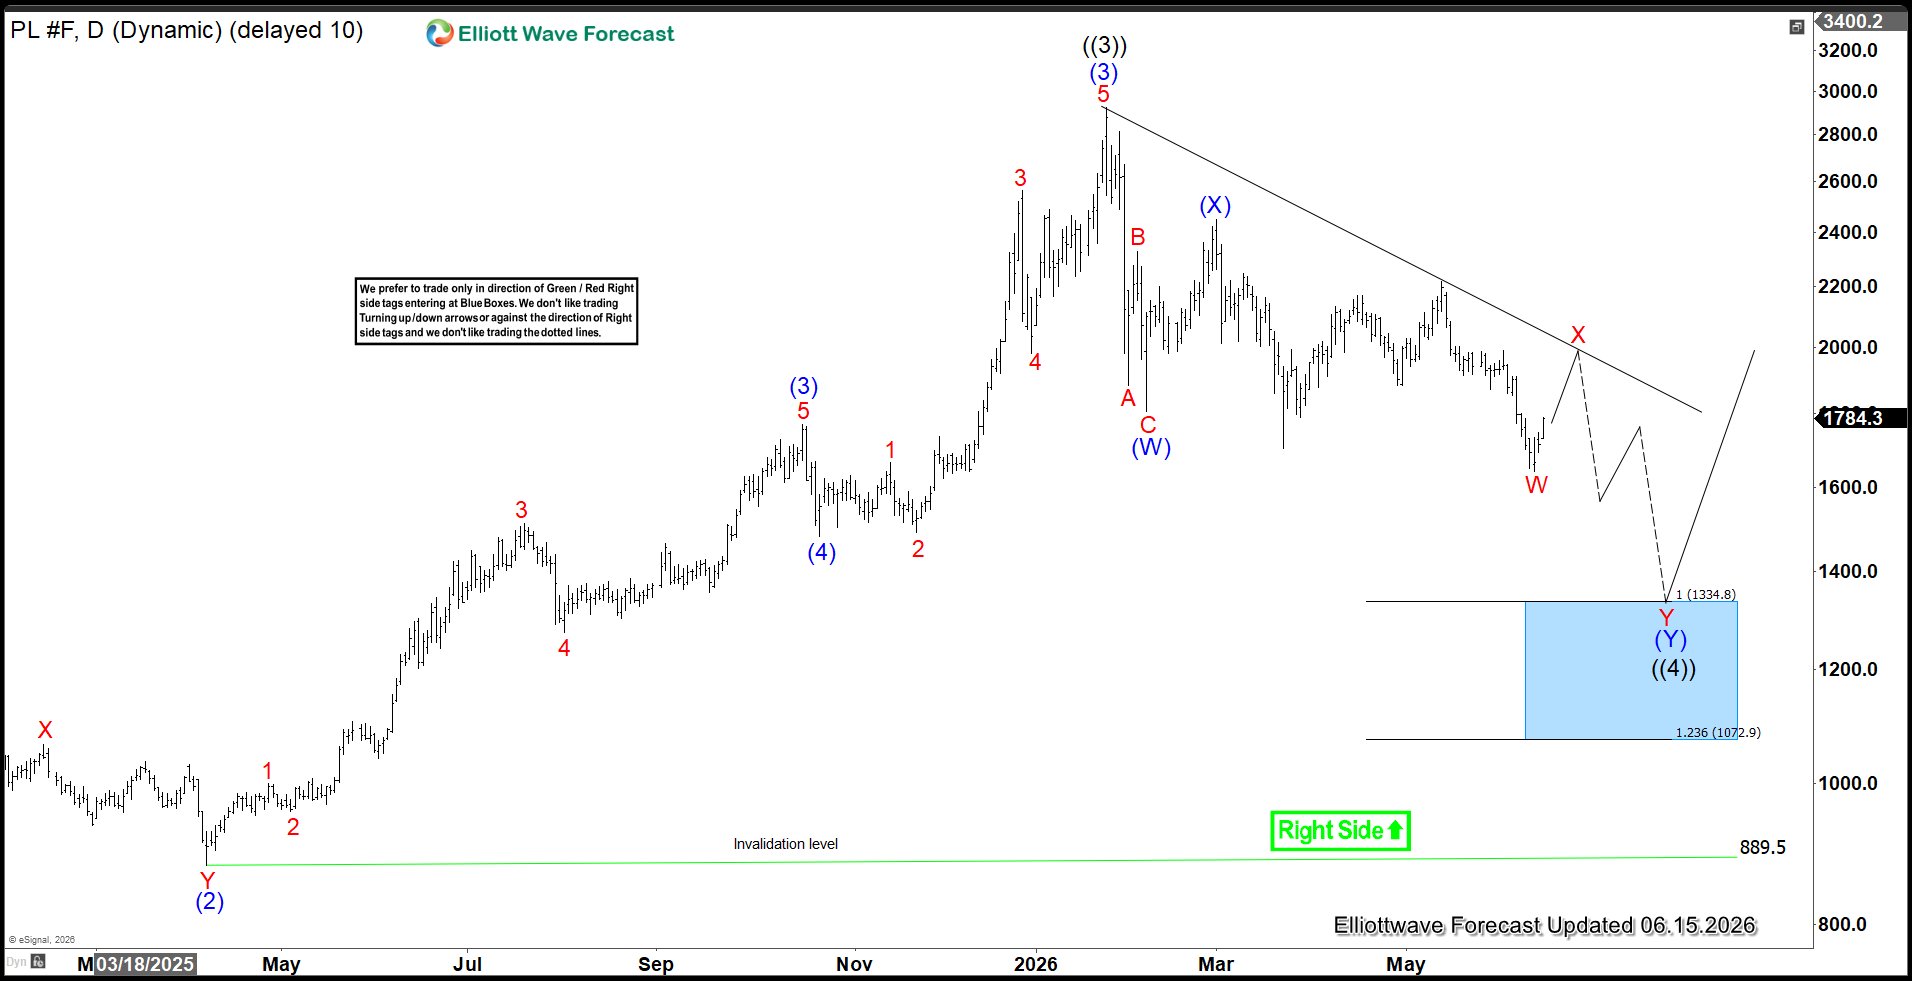
On the daily Platinum chart, the advance to 2925 is identified as the completion of wave ((3)). The market has since turned lower, with wave ((4)) unfolding and still capable of pressing further into the 1072–1334 zone. This area represents the 100%–161.8% Fibonacci extension of wave (W). The primary expectation remains for additional downside toward this target.
An alternate view considers the possibility of truncation, which would negate further weakness. That scenario gains weight only if Platinum decisively breaks above the bearish trend line drawn from the wave ((3)) peak, signaling that the correction has already ended and the next leg higher is underway.