
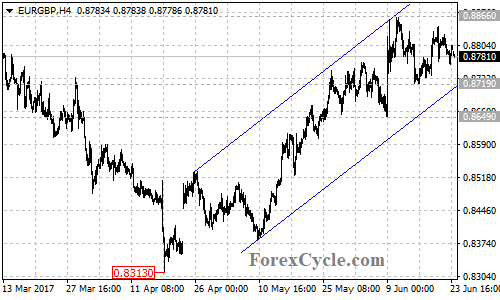
EURGBP’s bullish movement from the April 18 low of 0.8313 extended to as high as 0.8866. After touching the resistance of the January 16 high of 0.8851, the pair pulled back and formed a sideways movement in a trading range between 0.8719 and 0.8866.
On the upside
There is an ascending price channel with support at its bottom trend line on the 4-hour chart. As long as the pair is in the channel, the pullback from 0.8866 could be treated as consolidation of the uptrend and another rise to test the 0.8851 resistance is still possible.
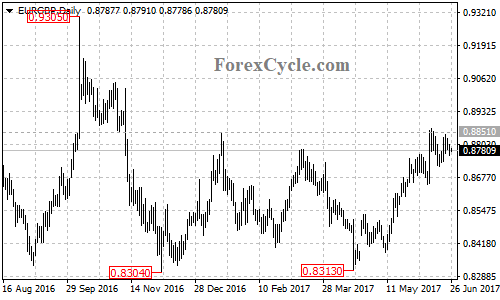
As discussed before, EURGBP might be forming a double bottom pattern on its daily chart, with neck line resistance at the January 16 high of 0.8851. A clear break out of this level will confirm that a long term bullish movement is in order, and the measured move target would be at around 0.9400.
On the downside
Near term support is at the bottom trend line of the price channel on the 4-hour chart, a clear below the channel support could take price to the key support level at 0.8649. Below this level will indicate that the bullish movement from 0.8313 had completed at 0.8866 already. This could trigger another fall to retest the support at the December 2016 low of 0.8304.
Technical levels
Support levels: 0.8715 (the bottom trend line of the channel on 4-hour chart), 0.8649 (the June 8 low), 0.8304 (the December 2016 low).
Resistance levels: 0.8851 (the January 16 high), 0.9305 (the October 2016 high).