
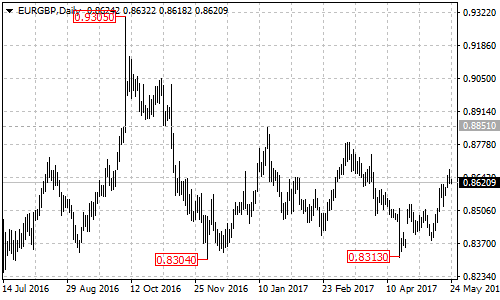
EURGBP might be forming a double bottom pattern on its daily chart. The first bottom is at the December 2016 low of 0.8304, and the second bottom is at the April 18 low of 0.8313. The neckline is at the January 16 high of 0.8851. Price has to test and breakout of the neckline to confirm that a long term bullish movement is in order.
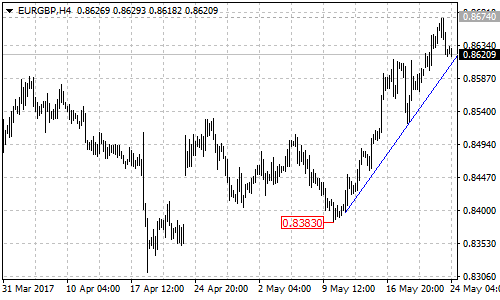
On the 4-hour chart, there is a short term bullish movement from 0.8383 with a rising trend line support at around 0.8605. As long as the pair is above the trend line, the bullish movement could be expected to continue and further rise to test the neckline on the daily chart is possible. The key support for this uptrend is at 0.8565, only a breakdown below this level will indicate that the uptrend had completed at 0.8674 already, then the following pullback could bring price back into 0.8450 zone.
Let’s come back to the daily chart. An upside break of the neckline could confirm that a long term bullish movement is underway. This will take price up by 550 pips to around 0.9400, the measured move target of the double bottom pattern. On the other side, if the pair failed to break above 0.8851 neckline resistance, lengthier sideways movement in a trading range between 0.8304 and 0.8851 could be seen to follow.
Technical levels
Support levels: 0.8605 (the trend line support on 4-hour chart), 0.8565 (key support), 0.8383 (May 10 low), 0.8304 (December 2016 low).
Resistance levels: 0.8674 (May 23 high), 0.8851 (the neckline of the double bottom pattern), 0.9305 (October 2016 high).