
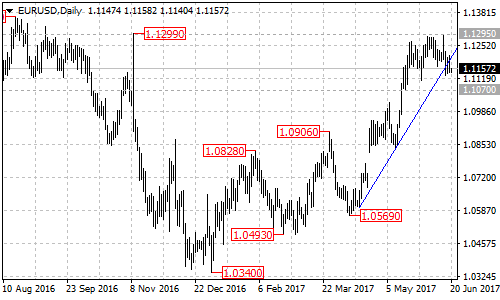
Under pressure by the resistance of the November 2016 high of 1.1299, the EURUSD pair pulled back from 1.1295 and broke below the major bullish support trend line at 1.1160 on its daily chart, indicating that a short term top had been formed. Sideways movement in a trading range between 1.1070 and 1.1295 would likely be seen over the next several days.
On the upside
The key support is at 1.1070, as long as the pair is above this level, the price action in the trading range between 1.1070 and 1.1295 could be treated as consolidation of the uptrend from the April 10 low of 1.0569, and another rise to test 1.1450 neckline resistance is still possible.
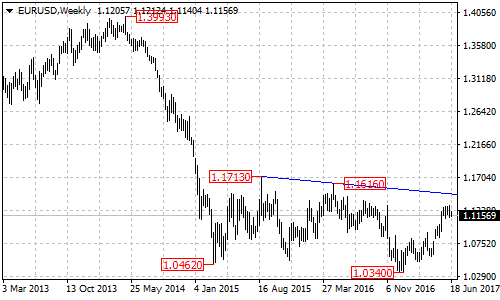
As discussed before, EURUSD might be forming a double bottom pattern on its weekly chart, with neckline resistance at around 1.1450. The price has to break through the neckline before confirming this reversal formation. A break through the neckline resistance could take price to the measured move target of 1.2700.
Near term resistance is at 1.1299, a break of this level could signal resumption of the uptrend.
On the downside
A breakdown below 1.1070 key support will suggest that lengthier consolidation for the longer term uptrend from January 3 low of 1.0340 is underway, then the pair will find support at the 50% retracement taken from 1.0340 to 1.1295 at around 1.0800. Below this level will confirm that the uptrend from 1.0340 had completed at 1.1295 already, this could trigger another fall towards the psychological important level of 1.0000.
Technical levels
Support levels: 1.1070 (key support), 1.0800 (the 50% retracement), 1.0493 (February 22 low), 1.0340 (January 3 low), 1.0000 (psychological level).
Resistance levels: 1.1299 (near term resistance), 1.1450 (the neckline resistance), 1.1713 (August 2015 high), 1.2700 (measured move target).