
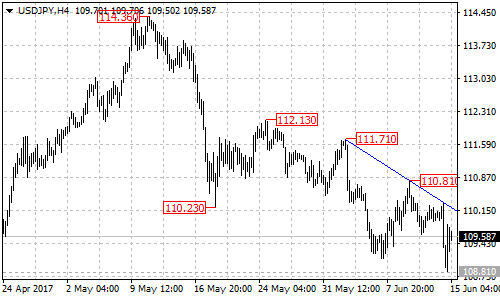
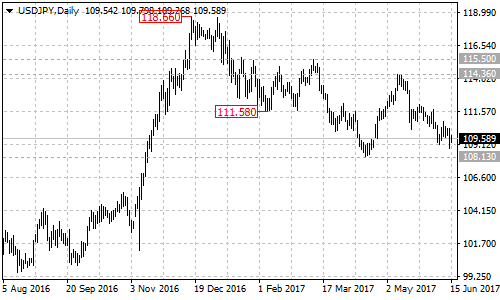
USDJPY stays below the bearish trend line from 111.71 to 110.81 with resistance at around 110.20 on its 4-hour chart, suggesting that the pair remains in bearish movement from the May 11 high of 114.36. As long as the pair is below the trend line, the bearish move could be expected to continue, and next target would be at the April 17 low of 108.13. A breakdown below 108.13 support will indicate that the longer term downtrend from the December 2016 high of 118.66 has resumed, then the pair will find next support at the 61.8% Fibonacci retracement taken from the June 2016 low of 98.97 to 118.66 at around 106.50.
On the upside
As we mentioned last month, USDJPY broke above the major bearish price channel on its daily chart. The pair would be in uptrend from the April 17 low and the fall from the May 11 high would possibly be correction of the uptrend. A clear break above the descending trend line on the 4-hour chart could bring price to test the 110.81 key resistance, above this level will confirm that the correction pullback had completed at 108.81 already, then the following bullish movement could bring price to retest the resistance at the March 10 high of 115.50.
Technical levels
Support levels: 108.13 (April 17 low), 106.50 (61.8% Fibonacci retracement).
Resistance levels: 110.20 (the trend line on 4-hour chart), 110.81 (key resistance), 112.13 (May 24 high), 114.36 (May 11 high), 115.50 (March 10 high).