
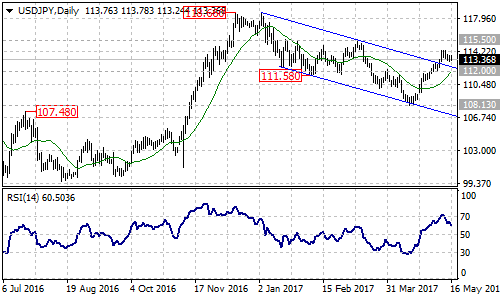
USDJPY moved above the top trend line of the descending price channel on daily chart, suggesting that the bearish movement from 118.66 had completed at 108.13 already. Further rise to test 115.50 resistance is still possible in the near future.
Correction is necessary
The pair is under pressure by the 115.50 (Mar 10 high) resistance and the 14 Relative Strength Index on the daily chart is in overbought region, indicating that a downward correction may occur in the coming days. There is a 20 Moving Average acting as a near term support around 112.00, a breakdown below this level will suggest that correction for the uptrend from 108.13 is underway and the target for the correction pullback would be around 110.50.
Key resistance
The key resistance is located at 115.50, a break out of this level will confirm that the long term uptrend from 98.97 (2016 low) has resumed, then the following bullish movement could bring price to 125.00 area.
On the other side, as long as 115.50 resistance holds, the price action from 111.58 (Feb 7 low) could possibly be consolidation of the downtrend from 118.66, and one more fall towards the support trend line of the price channel to complete the bearish movement is still possible.
Technical levels
Support levels: 112.00 (near term support), 108.13 (Apr 17 low), followed by the support trend line of the price channel.
Resistance levels: 115.50 (key resistance), 118.66 (Dec 2016 high).