
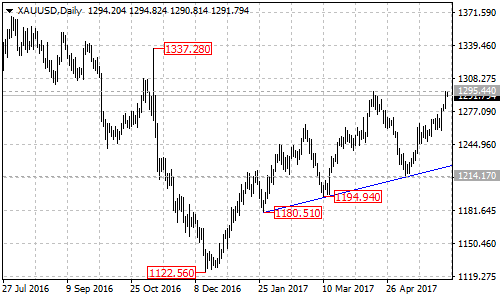
After touching the ascending trend line from the January 27 low of 1180.51 to the March 10 low of 1194.94 on its daily chart, XAUUSD rebounded strongly from 1214.17 and the pair is now facing 1295.44 resistance.
Will the bullish movement continue?
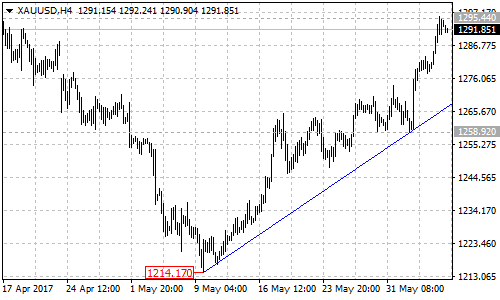
Let’s look into its 4-hour chart. There is a bullish trend line from the May 9 low of 1214.17 to the June 2 low of 1258.92 with support at around 1266.00 on its 4-hour chart, indicating that the pair remains in a bullish structure. As long as the XAUUSD pair is above the trend line, the uptrend from 1214.17 could be expected to continue. However, the pair is now under pressure by the resistance of the April 17 high of 1295.44, so sideways movement in a range between 1285.00 and 1295.44 would likely be seen in a couple of days.
On the upside
A break above 1295.44 resistance will confirm the long term uptrend from the December 2016 low of 1122.56 has resumed. This could trigger another rise to the next resistance level at the November 2016 high of 1337.28. If this level gives way, the pair will find resistance at the July 2016 high of 1375.11.
On the downside
Key support for the short term uptrend from 1214.17 is located at the ascending trend line on its 4-hour chart, only a clear break below the trend line support will indicate that the uptrend is complete, then another fall to test the support of the rising trend line on the daily chart could be seen.
Technical levels
Support levels: 1285.00 (near term support), 1266.00 (trend line on 4-hour chart), 1.258.92 (June 2 low), 1224 (trend line on daily chart).
Resistance levels: 1295.44 (April 17 high), 1337.28 (November 2016 high), 1375.11 (July 2016 high).