
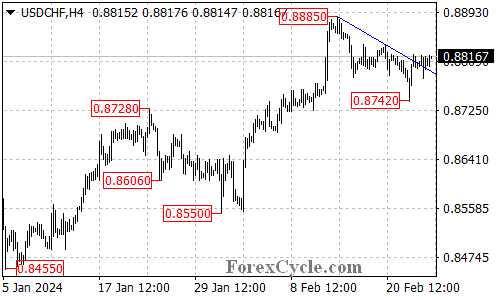
USDCHF has displayed a potential trend reversal, breaking above the falling trend line on its 4-hour chart. This move suggests the downside movement from 0.8885 might have concluded at 0.8742, paving the way for a potential upside. However, it’s crucial to analyze the situation further to understand the sustainability of this move.
Upside Potential: Can the Bulls Maintain Momentum?
- 0.8840 Resistance in Sight: If the bulls can push the price above the immediate resistance level of 0.8840, it could trigger a further rise towards the previous high resistance at 0.8885. Successfully surpassing this level would be a significant bullish signal, potentially aiming for 0.9000.
Support Levels to Watch for Potential Downturn
- 0.8780 Initial Hurdle: A breakdown below the initial support level of 0.8780 could indicate a loss of momentum and a potential reversal. This might lead to a retest of the 0.8742 support level.
- 0.8742 and 0.8700: Lower Support Awaits: A further decline below 0.8742 could open the door for a fall towards the 0.8700 area, potentially signifying a resumption of the downtrend.
Overall Sentiment:
The breakout above the falling trend line is a positive development for USDCHF bulls. However, the sustainability of this move hinges on overcoming the resistance levels and holding above the support zones. Monitoring the price action around these key levels will be crucial in determining whether this is a genuine trend reversal or a temporary pullback within the downtrend.