USDJPY’s recent rally has hit a snag, breaking below the rising price channel on the 4-hour chart. Now, the pair finds itself caught in a tug-of-war between bulls and bears, oscillating within a trading range. Let’s analyze the technicals to understand whether this is a temporary pause or a sign of a deeper decline.
Sideways Consolidation or Bullish Continuation?
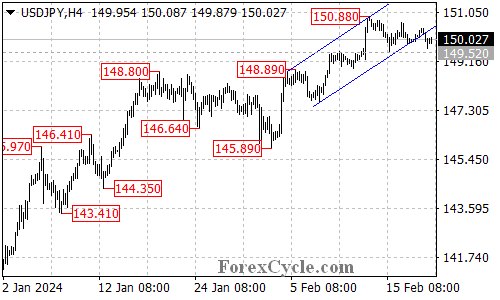
- Trading Range Defined: Currently, USDJPY is confined within a range of 149.52 and 150.88. As long as the price stays within this zone, two interpretations are possible:
- Consolidation: This sideways movement could be seen as a healthy pause within the ongoing uptrend that began at 145.89. If the bulls regain control, a breakout above 150.88 resistance could signal further gains towards 151.90.
- Trend Change: Alternatively, the range could be a precursor to a trend reversal. If the bears overpower the bulls and push the price below 149.52 support, it would suggest the uptrend from 145.89 might be over.
Support and Resistance Levels to Watch
- Support: The crucial support level to watch is 149.52. A breakdown below this level would indicate a potential trend reversal and a decline towards the next support zone around 147.50.
- Resistance: If the bulls manage to hold the fort at 149.52 and push the price back up, the initial hurdle to overcome is the resistance at 150.88. Surpassing this level would open the door for a potential retest of the previous high at 151.90.
Overall Sentiment
The technical picture presents mixed signals for USDJPY. The trading range creates uncertainty, leaving the near-term direction unclear. While holding above 149.52 and breaking above 150.88 suggest potential bullish continuation, a breakdown below support could signal a trend reversal and further decline. Monitoring the price action around the mentioned support and resistance levels will be vital in determining the pair’s next move.