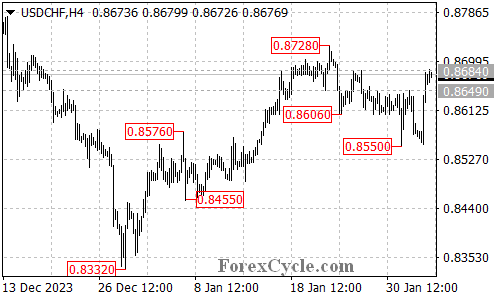
USDCHF has exhibited a bullish technical pattern on its 4-hour chart, suggesting a potential reversal of the recent downtrend. Let’s dissect the key technical aspects to understand what this means for the pair’s future direction.

Double Bottom Breakout and Trend Reversal Signal
- Double Bottom Pattern: USDCHF formed a double bottom pattern, indicating a potential reversal of the downtrend that began at 0.8728.
- Breakout: The pair decisively broke above the neckline resistance at 0.8649, confirming the bullish pattern and suggesting that the decline from 0.8728 might have ended at 0.8550.
Key Resistance Levels to Watch
- Immediate Test: USDCHF is currently testing the 0.8684 resistance level.
- Breakout Target: Surpassing this level could open the door for a further rally towards the next resistance zone at 0.8728, the previous swing high.
- Further Upside Potential: If the momentum persists and the pair breaks above 0.8728, the 0.8800 area could be the next target.
Support Level for Potential Downturn
- Initial Support: In case of a pullback, the initial support to watch is at 0.8625.
- Breakdown Scenario: A decline below this level could trigger another downward move, potentially retesting the double bottom support at 0.8550.
Overall Sentiment
The double bottom breakout and resistance test paint a cautiously optimistic picture for USDCHF. A confirmed breakout above 0.8684 could signal the start of an uptrend, with potential targets at 0.8728 and 0.8800. However, a breakdown below 0.8625 would indicate a loss of bullish momentum and suggest a retest of the 0.8550 support.
