
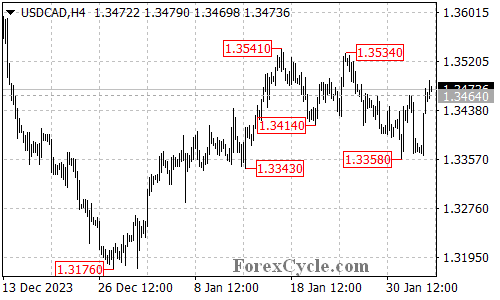
The USDCAD pair has formed a double bottom pattern on its 4-hour chart, potentially indicating a shift in momentum. Let’s delve into the technical details to understand what this means for the pair’s future direction.
Double Bottom Breakout and Potential Trend Reversal
- Pattern Formation: USDCAD has formed a double bottom pattern, suggesting a possible reversal of the recent downtrend that started at 1.3541.
- Neckline Break: The pair has decisively broken above the neckline resistance at 1.3464, which strengthens the bullish signal and implies that the decline from 1.3541 might have found support at 1.3358.
Resistance Levels and Potential Upside Targets
- First Hurdle: The immediate resistance to overcome is at 1.3541, the previous swing high and a psychological level.
- Breakout Target: Surpassing this level would significantly boost the bullish momentum and pave the way for a potential rally towards the 1.3600 area.
- Further Upside: If the uptrend continues, the next target could be around 1.3670, followed by 1.3750.
Support Level and Potential Downturn
- Immediate Cushion: The initial support level to watch in case of a pullback is at 1.3425.
- Breakdown Scenario: A decline below this level could trigger another downward move, potentially retesting the double bottom support at 1.3358.
Overall Sentiment
The double bottom breakout suggests a potential bullish reversal for USDCAD. However, confirmation is needed. A sustained move above 1.3541 would strengthen the bullish case and open doors for further upside. Conversely, a breakdown below 1.3425 would indicate a loss of momentum and suggest a continuation of the downtrend.