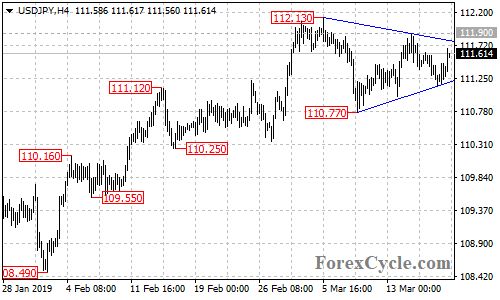
USDJPY is forming a triangle pattern on the 4-hour chart. The triangle pattern is likely consolidation for the uptrend from 105.05 (Jan 3 low), a breakout of the upper border of the pattern could trigger further upside movement towards 113.00 area. On the other side, a breakdown below lower border of the pattern could take the price into 110.00 zone.


