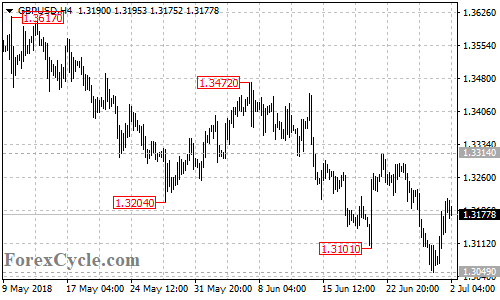
GBPUSD moved sideways in trading range between 1.3049 and 1.3314. As long as 1.3314 resistance holds, the downside movement from 1.3472 could be expected to continue and a breakdown below 1.3049 support could take the price towards 1.2900. On the upside, a breakout of 1.3314 resistance would indicate that lengthier consolidation for the downtrend from 1.4376 (Apr 17 high) is underway, then further rally to 1.3450 area could be seen.