ForexCycle.com
EA Builder
  • Home
  • Forex Analysis
    • Long Term Forex Analysis
    • Short Term Forex Analysis
    • Special Focus
    • Daily Forex Reports
    • Forex Signals
  • Forex Articles
    • Market Cycle
    • Indicator
    • Elliott Wave
    • Fibonacci Sequence
    • Forex Market
    • Forex Trading
    • Technical Analysis
    • Chart Pattern
  • Trading Strategy
  • Forex Brokers
    • Avatrade
    • Broker News
    • Broker Review
  • Elliott Wave Courses
    • Markets Reverse
    • 5 Ways Using Trendlines
    • Overview of MACD
    • Relative Strength Index
    • Japanese Candlesticks
    • Moving Averages
    • Fibonacci Ratios
    • Two-Bar Pattern
    • Market Myths Exposed
  • Contact Us

GBPUSD Daily Analysis – October 27, 2017

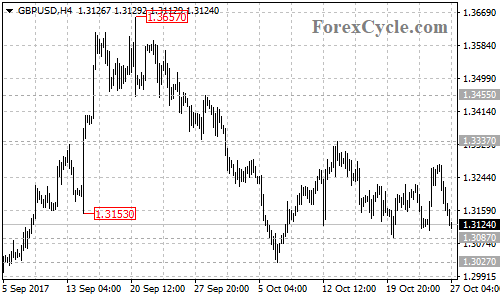
GBPUSD moved sideways in a trading range between 1.3087 and 1.3337. The pair is now facing 1.3087 support, a breakdown below this level could trigger another fall to the major support trend line on the daily chart. Resistance is at 1.3337, above this level will indicate that the upside movement from 1.3027 has resumed, then next target would be at 1.3455.

GBPUSD 4-hour chart

Author ForexCycle.comPosted on October 27, 2017Categories Short Term Forex AnalysisTags GBPUSD

Post navigation

Previous Previous post: EURUSD Daily Analysis – October 27, 2017
Next Next post: AUDUSD Daily Analysis – October 27, 2017

Resources

  • Unlock Your Trading Potential with EA Builder
  • Elliott Wave Principle

Recent Posts

  • SPY Elliott Wave Outlook: Wave (3) Nearing Termination
  • Biotech Surge: XBI Ends Correction and Rallies as Expected
  • Elliott Wave Blue Box Payoff: CADJPY Drops as Predicted
  • Alnylam (ALNY) Should Rally Into $479-$494 Before Correction Start
  • NVIDIA Corp. $NVDA Blue Box Area Offers A Buying Opportunity
  • Magnificent Seven ETF (MAGS) Set to End Cycle from April 2025 Low
  • Lennox International (LII) Elliott Wave Analysis – Correction Ahead Before the Next Rally
  • IRFC Elliott Wave Analysis: Wave II Correction Nearing Completion Before Major Bullish Rally
  • iShares Russell 2000 ETF (IWM)- Elliott Wave Buying the Dips at the Blue Box
  • KO Alert: Is an Ending Diagonal About to Disrupt the Rally?
  • Facebook
  • Instagram
  • Twitter
  • LinkedIn
  • Telegram
  • Home
  • Forex Analysis
  • Forex Articles
  • Contact Us
  • Forex Blog
  • Disclaimer
  • Forex Resources
  • Archives
  • RSS
Copyright © 2005 - 2025 ForexCycle.com. All rights reserved.