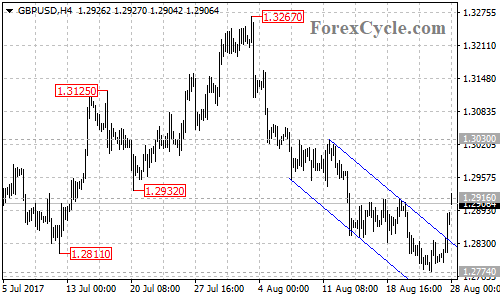
GBPUSD broke above the top trend line of the price channel on its 4-hour chart, indicating that the downside movement from 1.3267 had completed at 1.2774 already. Further rise to test next resistance level at 1.3030 could be expected in the coming days. Support levels are at 1.2850 and 1.2774, only break below these levels could trigger another fall towards 1.2600.