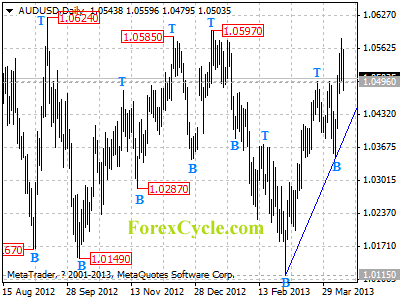
AUDUSD is facing 1.0597 resistance, a break above this level will indicate that the sideways movement in a range between 1.0115 and 1.0624 (Sep 14, 2012 high) has completed, then further rise to 1.0700 – 1.0800 area could be seen. Support is now at the upward trend line on daily chart, only a clear break below the trend line support will indicate that the upward movement from 1.0115 has completed, then lengthier sideways movement in the range could be expected to follow.
For long term analysis, AUDUSD had formed a cycle bottom at 1.0115 on weekly chart. Further rise towards 1.1080 (Jul 27, 2011 high) could be expected over the next several months.

