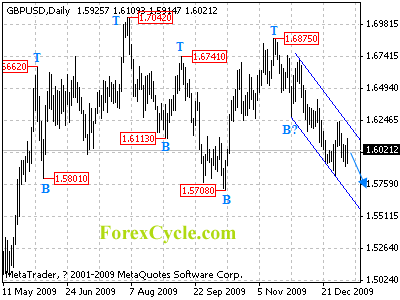
GBPUSD stays in a falling price channel on daily chart and remains in downtrend from 1.6875. Deeper decline to test 1.5708 is still possible next week. Resistance is located at the upper border of the falling price channel. As long as the channel resistance holds, downtrend could be expected to continue.
For long term analysis, GBPUSD has formed a cycle bottom at 1.5708 level on weekly chart. Sideways consolidation in range between 1.5708 and 1.7042 is expected in next several weeks and another fall towards 1.4800 is possible.


