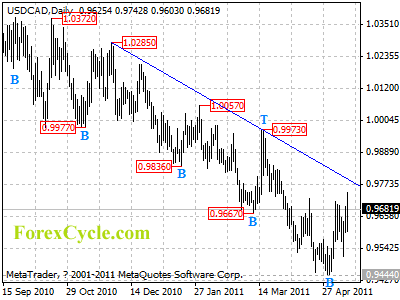
USDCAD had formed a cycle bottom at 0.9444 on daily chart. Further rise towards the downtrend line from 1.0285 to 0.9973 is expected next week, a clear break above the trend line resistance will indicate that the longer term downtrend from 1.0672 had completed at 0.9444 already, then the following upward move could bring price to 1.0000 area.
For long term analysis, USDCAD might be forming a cycle bottom at 0.9444 on weekly chart. Key resistance is at 0.9800, a break above this level will confirm the cycle bottom.