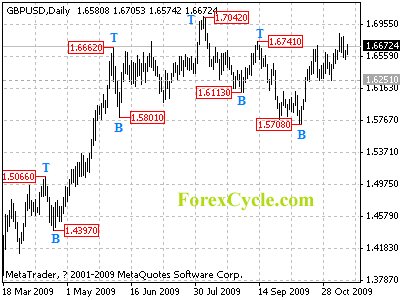
GBPUSD broke above 1.6741 resistance, suggesting that the fall from 1.7042 has completed at 1.5708 level already. Further rise towards 1.7042 would more likely be seen next week. Support level is at 1.6251, below this level will signal another fall towards 1.5708.
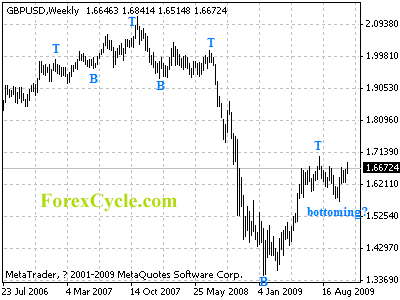
For long term analysis, GBPUSD might be forming a cycle bottom at 1.5708 level on weekly chart, key resistance is at 1.7042, a break above this level will confirm the cycle bottom.


