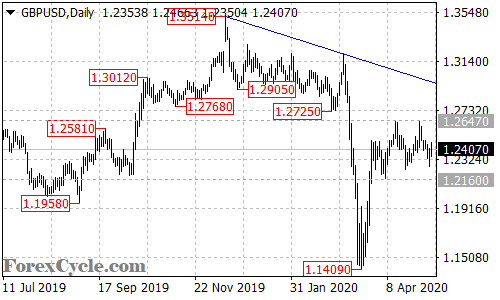
GBPUSD continued its sideways movement in a trading range between 1.2160 and 1.2647. The sideways movement is likely consolidation for the uptrend from 1.1409, a breakout of 1.2647 resistance could trigger further upside movement towards the falling trend line on the daily chart. On the downside, a breakdown below 1.2160 support would indicate that the upside movement had completed at 1.2647 already, then another fall towards 1.1400 could be seen.