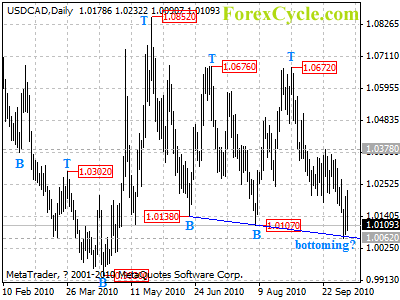
Being supported by the trend line from 1.0138 to 1.0107, USDCAD rebounded from 1.0062, suggesting that a cycle bottom is being formed on daily chart, key resistance is at 1.0235, a break above this level will confirm the cycle bottom, then another rise to 1.0600 could be seen to follow. However, as long as 1.0235 resistance holds, further decline towards 0.9930 previous low is still possible.
For long term analysis, USDCAD formed a cycle top at 1.0852 level on weekly chart. Rang trading between 0.9930 and 1.0852 would more likely be seen in next several weeks.


