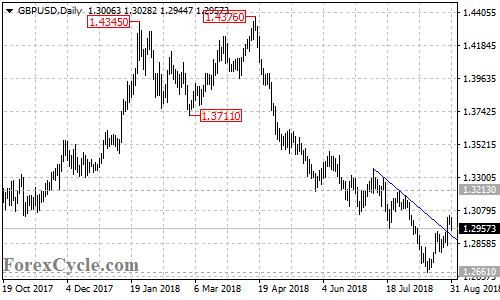
GBPUSD broke above the falling trend line on the daily chart, suggesting that lengthier consolidation for the downtrend from 1.4376 is needed. Sideways movement in a range between 1.2661 and 1.3213 would likely be seen in a couple of weeks. As long as 1.3213 resistance holds, the downtrend could be expected to resume and further decline to 1.2300 area is still possible after the consolidation. Only a breakout of 1.3213 resistance could signal completion of the downtrend.