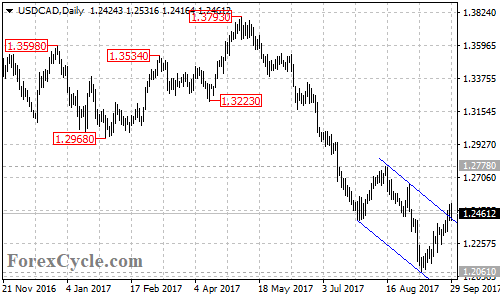
USDCAD broke above the top trend line of the price channel on its daily chart. Further rise towards 1.2778 key resistance could be expected in a couple of weeks, a breakout of this level would confirm that the bearish movement from 1.3793 had completed at 1.2061 already, then the following bullish move could take price back into 1.3200 zone. On the downside, as long as 1.2778 resistance holds, the bounce from 1.2061 would possibly be consolidation of the downtrend from 1.3793, and one more fall towards 1.1600 is still possible.