
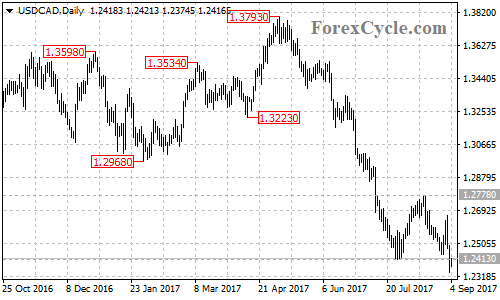
After a sideways movement in a trading range between 1.2413 and 1.2778, USDCAD broke below 1.2413 previous low support and extended its downside movement from 1.3793 to as low as 1.2339.
On the downside
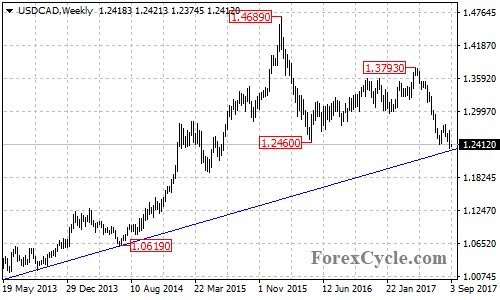
The USDCAD pair is facing a major support trend line from the September 2012 low of 0.9632 to the July 2014 low of 1.0619 on the weekly chart, now at around 1.2350. A clear break below the trend line support could take price to next support level at the 50% retracement, taken from the July 2011 low of 0.9406 to 1.4689 at around 1.2050. And the final target for this bearish movement would be at 1.1400 – 1.1600 area.
On the upside
Near term resistance is at 1.2500, a break above this level could indicate that lengthier consolidation for the downtrend is underway, then the following rally could bring price back to test 1.2778 resistance.
The 1.2778 level could be treated as key resistance of the downtrend from 1.3793. Above this level will confirm that the downtrend had completed at 1.2339 already, then next target would be at the January 31 low of 1.2968, the support-turned-resistance.
Technical levels
Support levels: 1.2350 (the bullish support trend line on the weekly chart), 1.2050 (the 50% retracement), 1.1400 – 1.1600 area.
Resistance levels: 1.2500 (near term resistance), 1.2778 (the August 15 high), 1.2968 (the support-turned-resistance).