

AMD continues to maintain a strong long-term bullish outlook despite the ongoing correction. The stock remains within the third cycle of a larger third supercycle that began from the October 2022 low, suggesting the current decline is corrective and should present another buying opportunity before the next leg higher.
Weekly Elliott Wave Analysis
On the weekly chart, wave (II) completed in October 2022, marking the start of wave (III). Wave I of (III) peaked in March 2024 after breaking above the wave (I) high, confirming a strong bullish trend. The subsequent wave II correction unfolded as a simple zigzag and found support in our Blue Box buying area in April 2025.
Elliott Wave Forecast members took advantage of this high-probability setup by buying from the Blue Box. From that April 2025 low, AMD rallied more than 600%, reaching a high above $580 in June 2026.
In strong trending markets, our preferred strategy is simple: wait for corrective pullbacks into the Blue Box and buy the dip. This approach has produced multiple successful trades across the weekly, daily, H4, and H1 timeframes.
Another standout opportunity developed during the March 2026 correction. After completing wave ((1)) of III with a powerful impulsive advance, AMD entered a wave ((2)) pullback that formed a double zigzag. The correction ended precisely within the Blue Box support area, providing another high-probability buying opportunity. From that level, the stock advanced another 200%, delivering substantial gains for members.
Current Focus: Wave ((4)) Pullback
The 200% rally from the March 2026 Blue Box completed wave ((3)) of III. Since the June 2026 peak, AMD has been correcting in wave ((4)). While the correction may already be complete, there is still a possibility it extends lower before the next impulsive advance begins.
Scenario 1: Wave ((4)) Is Complete
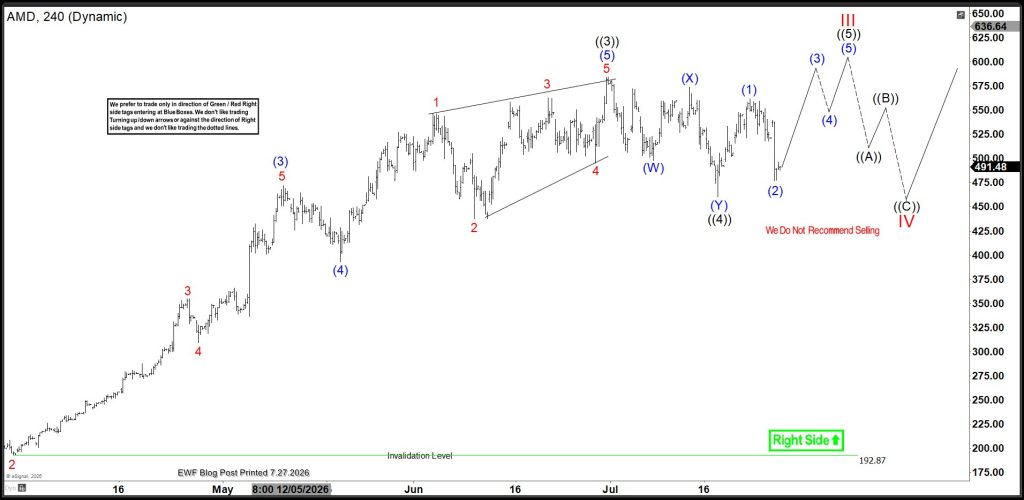
The H4 chart suggests wave ((4)) may have ended at the July 17, 2026 low. If this count is correct, AMD has already begun wave ((5)), with waves (1) and (2) potentially in place.
For this bullish scenario to remain valid, price must hold above the July 17 low and break above the wave (1) high. If that occurs, traders can look for new buying opportunities from H1 Blue Box pullbacks as wave ((5)) unfolds. The next upside objective remains in the 634–665 target area.
Scenario 2: Wave ((4)) Extends Lower
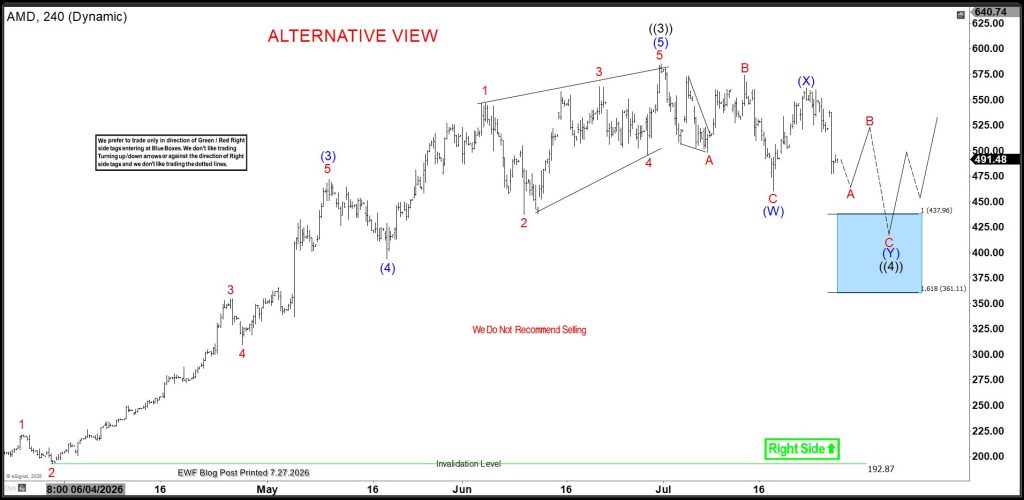
A break below the July 17 low would invalidate the first scenario and suggest wave ((4)) is still developing. In that case, the correction could evolve into a larger 15-swing structure, with the next high-probability buying zone located between 437 and 361—our Blue Box support area.
Regardless of which scenario unfolds, the larger trend remains bullish. Rather than chasing price, we continue to focus on buying at high-probability Blue Box areas where the risk-to-reward profile is most favorable.