ForexCycle.com
EA Builder
  • Home
  • Forex Analysis
    • Long Term Forex Analysis
    • Short Term Forex Analysis
    • Special Focus
    • Daily Forex Reports
    • Forex Signals
  • Forex Articles
    • Market Cycle
    • Indicator
    • Elliott Wave
    • Fibonacci Sequence
    • Forex Market
    • Forex Trading
    • Technical Analysis
    • Chart Pattern
  • Trading Strategy
  • Forex Brokers
    • Avatrade
    • Broker News
    • Broker Review
  • Elliott Wave Courses
    • Markets Reverse
    • 5 Ways Using Trendlines
    • Overview of MACD
    • Relative Strength Index
    • Japanese Candlesticks
    • Moving Averages
    • Fibonacci Ratios
    • Two-Bar Pattern
    • Market Myths Exposed
  • Contact Us

USDCAD Weekly Analysis – August 6, 2017

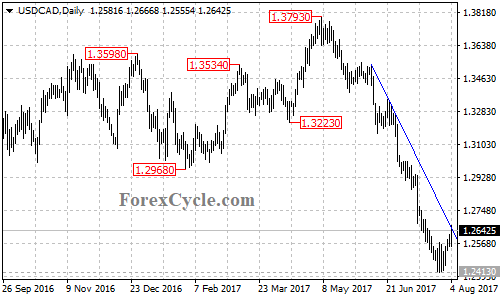
USDCAD is facing the resistance of the bearish trend line on its daily chart. As long as the trend line resistance holds, the downtrend could be expected to continue and next target would be at around 1.2280. On the upside, a clear break above the trend line resistance could take price to 1.2740 area.

USDCAD daily chart

Author ForexCycle.comPosted on August 6, 2017Categories Long Term Forex AnalysisTags USDCAD

Post navigation

Previous Previous post: USDJPY Weekly Analysis – August 6, 2017
Next Next post: Parallel Lives: The U.S. Stock Market and The New York City Subway

Resources

  • Unlock Your Trading Potential with EA Builder
  • Elliott Wave Principle

Recent Posts

  • BlackRock (BLK) Next Buying Opportunity Below $1,000
  • McDonald’s (MCD) is lagging, will it burn out or bounce back?
  • AIZ Elliott Wave Analysis: Short Term Trade Idea Aiming $250
  • QQQ : Found Buyers After Double Three Pattern
  • TXN Rebounds Strongly from Blue Box, Wave (3) Targets $285
  • BITO Proshares Bitcoin ETF Warning: Why Bitcoin Isn’t Ready to Fly Yet
  • Apple Inc. $AAPL Soars 30% from Blue Box Area, With $290 Target Still Ahead
  • Sprott Physical Silver Trust (PSLV) Surges to a New All‑Time High
  • Bloom Energy (BE) Favors Bounce Towards $120.2 Before Lower
  • IBKR Wave Forecast: Wave III Targets 86 Next, With Long-Term Bullish Aim Toward 166
  • Facebook
  • Instagram
  • Twitter
  • LinkedIn
  • Telegram
  • Home
  • Forex Analysis
  • Forex Articles
  • Contact Us
  • Forex Blog
  • Disclaimer
  • Forex Resources
  • Archives
  • RSS
Copyright © 2005 - 2025 ForexCycle.com. All rights reserved.