
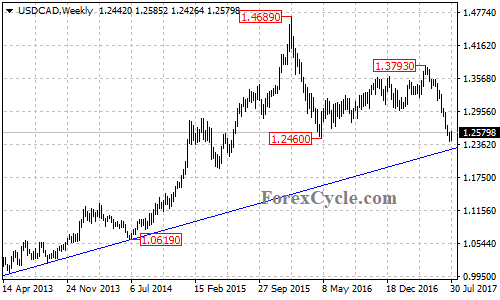
USDCAD recently broke below an important support level at the May 2016 low of 1.2460 and reached as low as 1.2413, confirming that the long term downtrend from the January 2016 high of 1.4689 had resumed.
On the downside
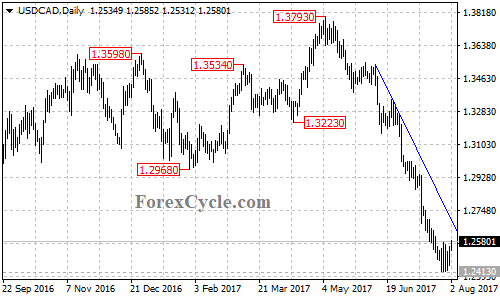
The USDCAD pair stays below a bearish trend line with resistance at around 1.2690 on its daily chart. As long as the price is below the trend line, the bearish movement from 1.3793 could be expected to continue and next target would be at around 1.2280.
There is a bullish support trend line from the September 2012 low of 0.9632 to the July 2014 low of 1.0619 on the weekly chart, with support now at 1.2280. A clear break below this trend line support could take price to the 50% retracement, taken from the July 2011 low of 0.9406 to 1.4689 at around 1.2050. The final target for this long term bearish movement would be at 1.1400 – 1.1600 area.
On the upside
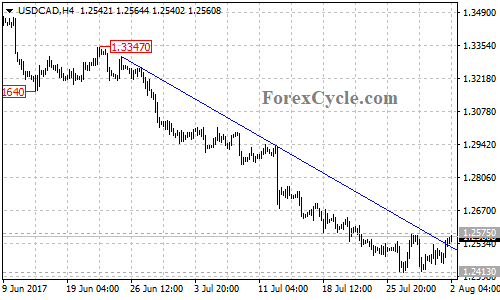
USDCAD broke above the bearish trend line on its 4-hour chart and is now facing 1.2575 resistance. A break above is level will indicate that a short term bottom has been formed at 1.2413, and the following correction rebound could bring price to test the resistance of the bearish trend line on the daily chart, followed by the 23.6% Fibonacci retracement taken from 1.3793 to 1.2413 at around 1.2740.
Technical levels
Support levels: 1.2280 (the ascending trend line on the weekly chart), 1.2050 (the 50% retracement).
Resistance levels: 1.2575, 1.2690 (the bearish trend line on the daily chart), 1.2740 (the 23.6% Fibonacci retracement).