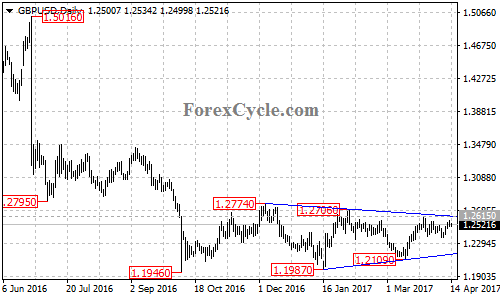
GBPUSD is forming a triangle pattern on daily chart. Resistance is at the upper trend line of the pattern, as long as this trend line resistance holds, sideways movement could be expected to continue and next target is to test the support of the lower trend line. On the upside, a clear break above the upper trend line resistance will indicate that the pair is starting a upward movement and next target would be at 1.3500 area.