Ichimoku combines a set of trending indicators and projects a unique “cloud” of anticipated resistance and support points to arrive at its take on market activity. As with any set of indicators, specific intersections between the various items produce high-probability trading signals, subject to the trader’s interpretation and bolstered by his experience using this novel tool.
Experience has shown that this system works more reliably with longer timeframes, making it more suitable for position, rather than, day traders. The longer periods help to eliminate market “noise”. Trading keys revolve around those instances when pricing candlesticks traverse over and under the various oscillating components. Newcomers often wince, due to the visual complexity presented, but once the newness passes, most appreciate how each part works in unison over time.
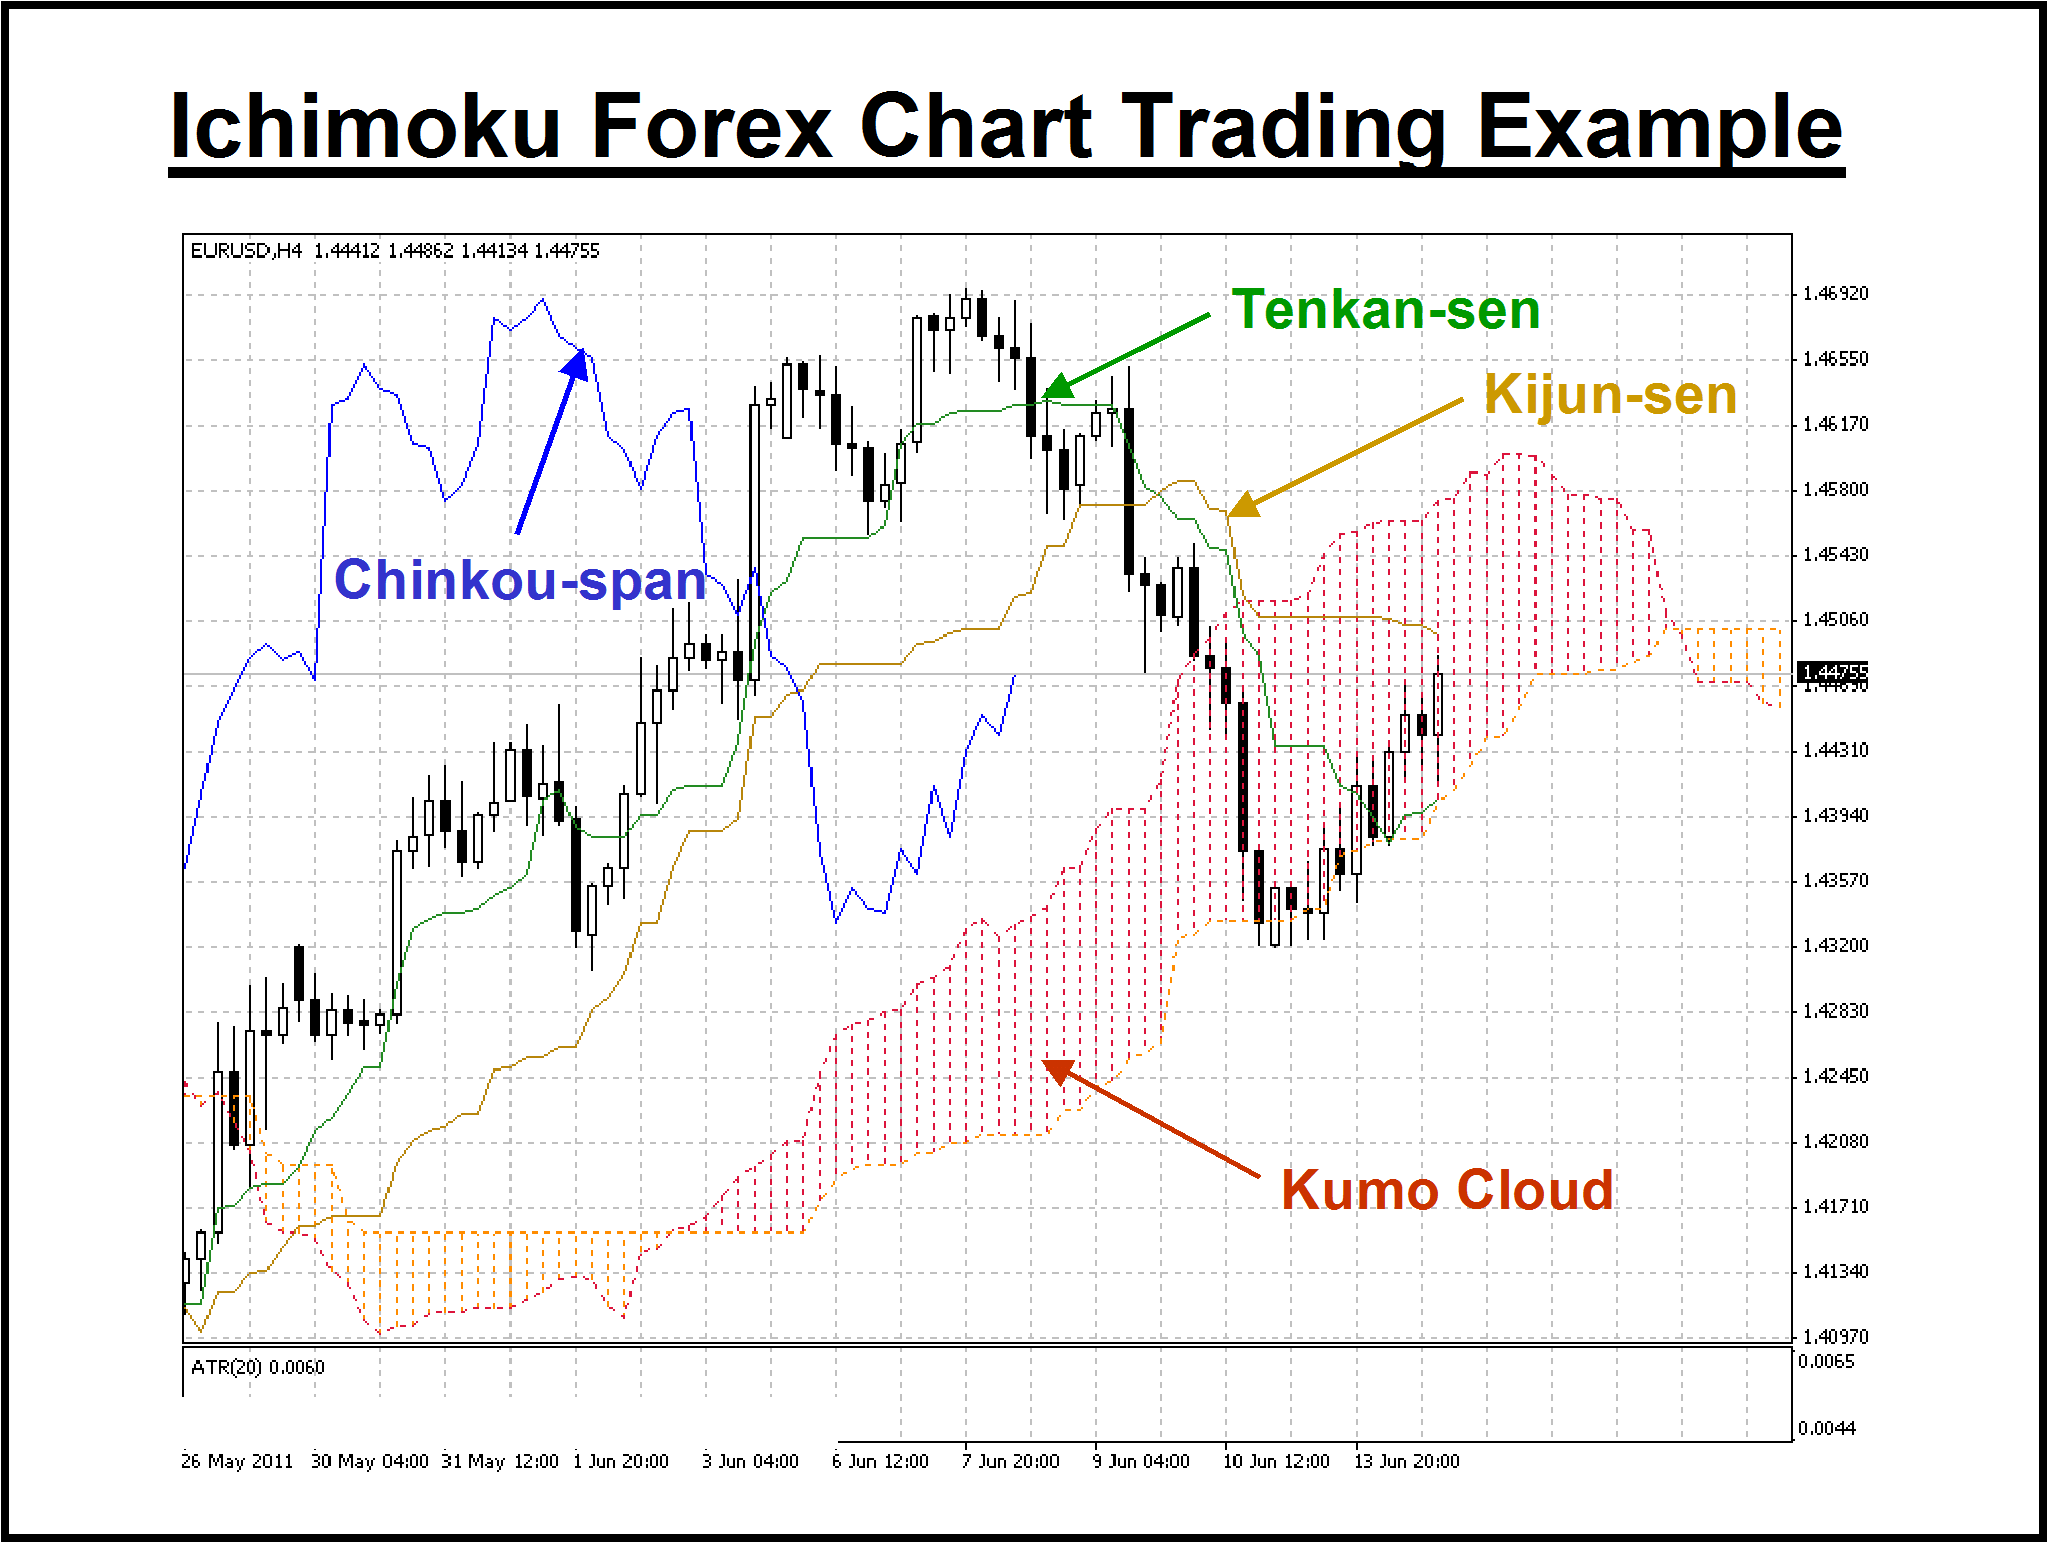
From a forex perspective, let’s begin by reviewing the 4-Hour chart for the “EUR/USD” currency pair presented below:

Here is a brief description of the four component parts presented above:
- Kumo Cloud: The shaded area represents the “cloud”, which oscillates between orange and red. Transition points are indicative of imminent changes in pricing behavior, but the borders depict projected support and resistance, derived from previous pricing activity. Traders key on those instances when candlesticks pierce the “cloud” or when various indicator lines traverse through the clouded sections;
- Tenkan-sen and Kijun-sen: These moving averages are calculated from previous highs and lows over 9 and 26 periods, respectively. They behave much like other dual-line scenarios where one line is quicker than the other. The “Green” line, or Tenkan-sen, is the quicker of the two. Trade alerts occur when it intersects with other components, while its slope is sometimes indicative of momentum;
- Chinkou-span: In this case, current pricing behavior, based on current closing prices, is moved backward 26 time periods. Experience has shown that, if Sellers or Buyers are dominating the action, its relative position to candlestick data indicates a type of market sentiment. Its position relative to the cloud can also be read as either a positive or negative signal, as well.
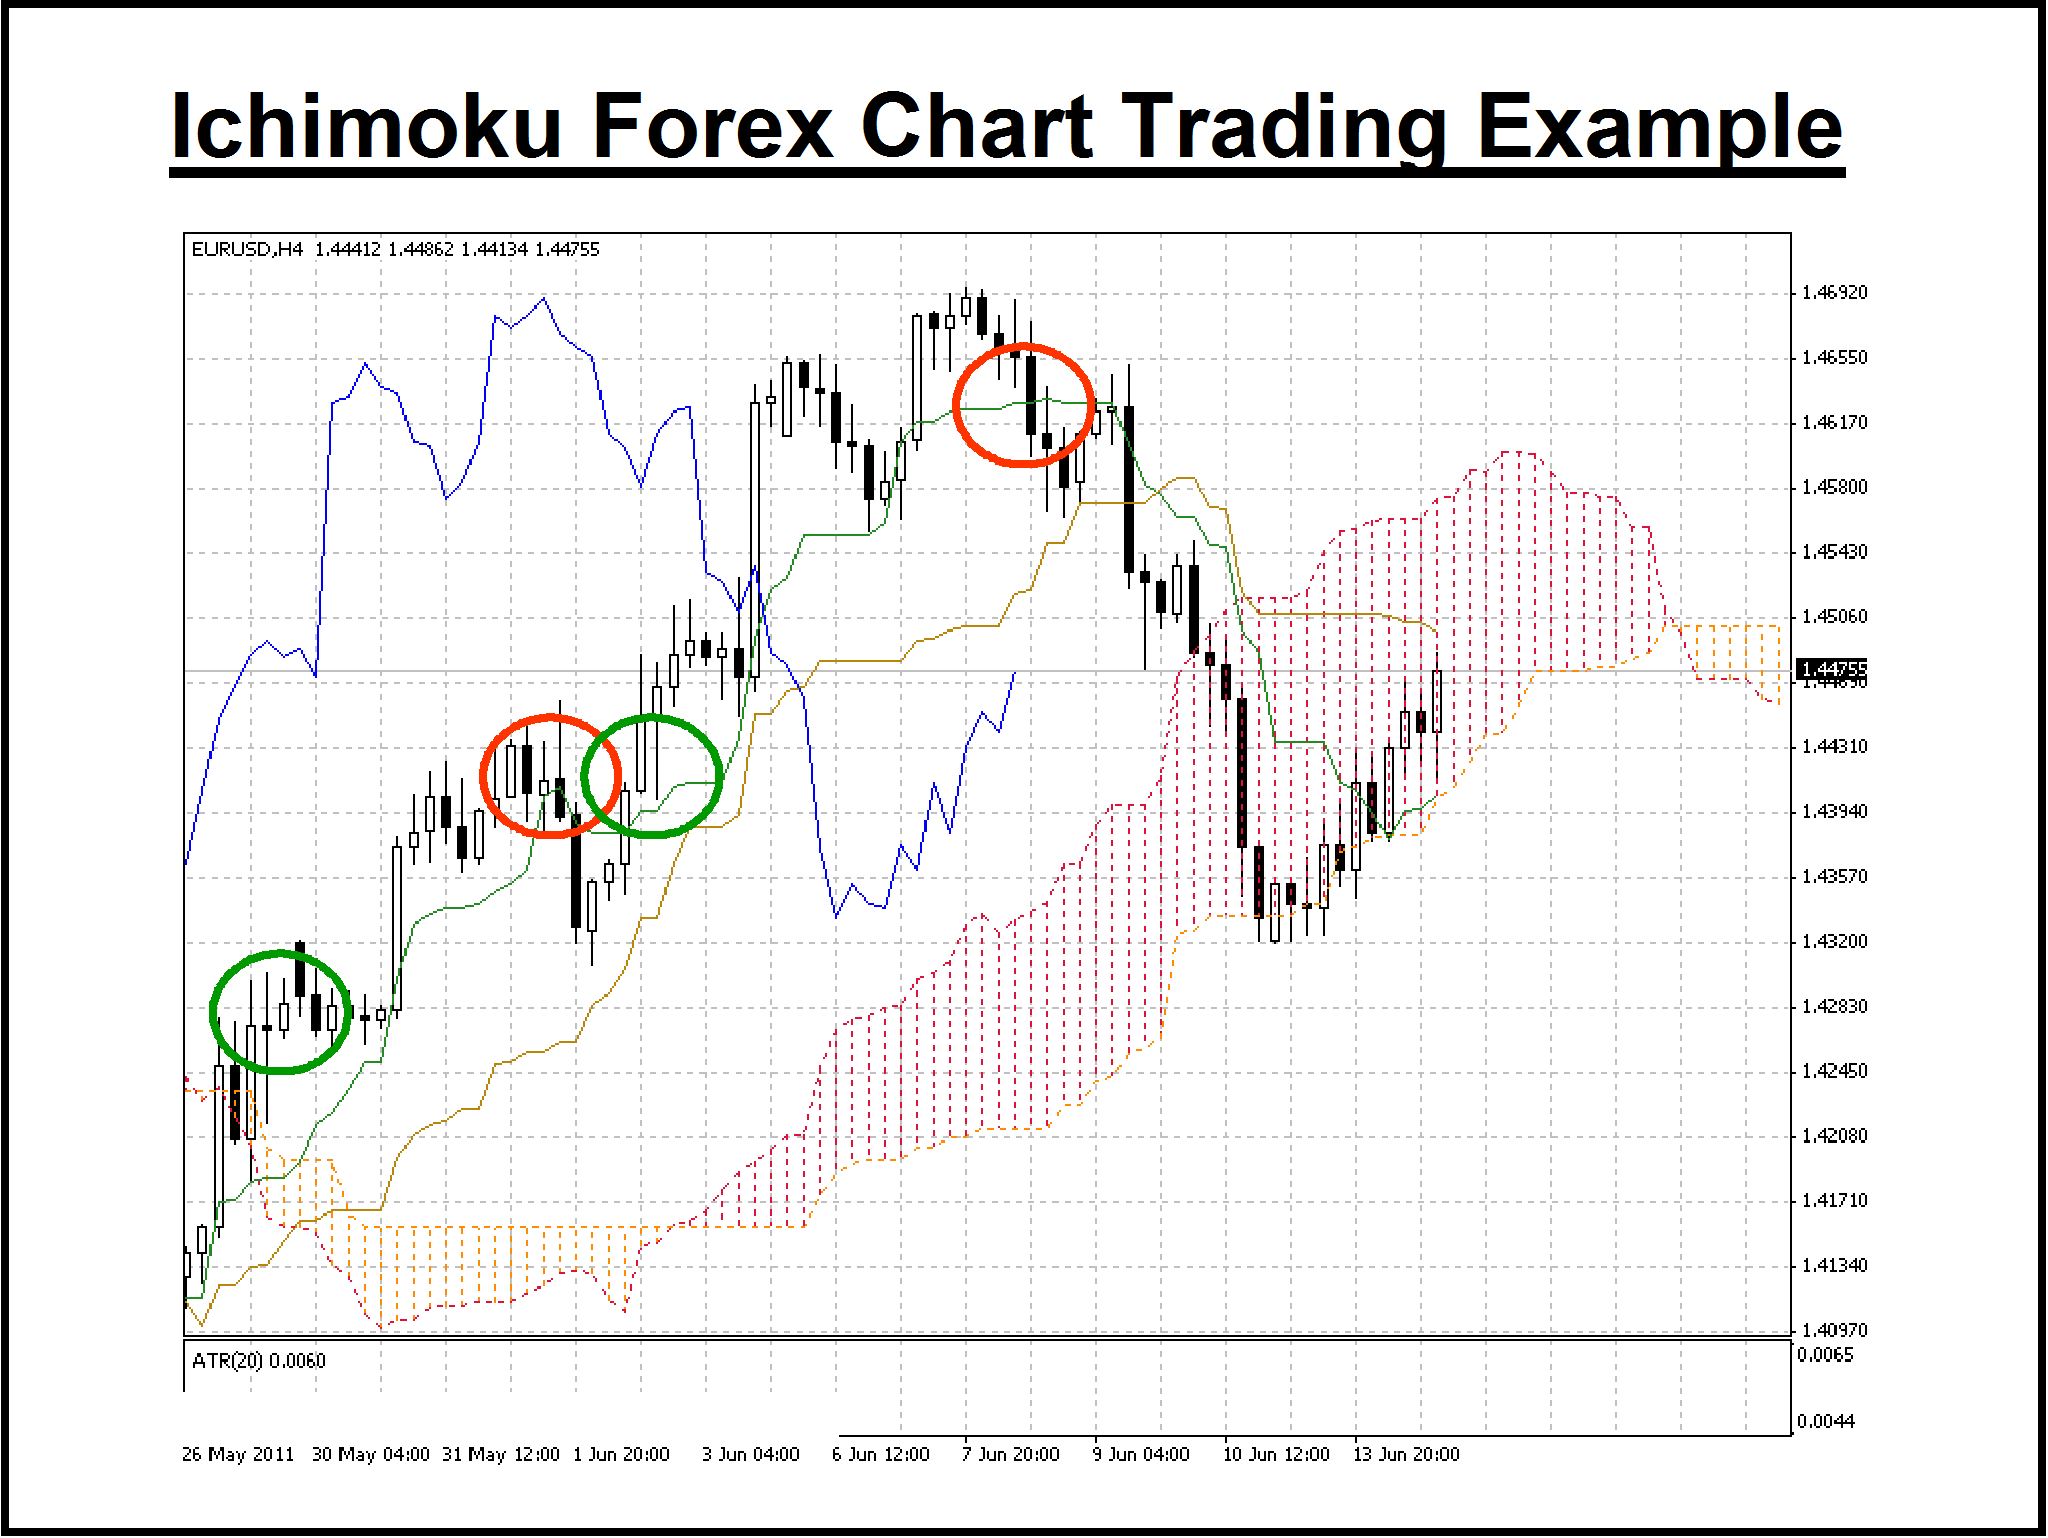
Commentaries on the forex market from Asia typically focus on where the pricing candlesticks are relative to the Kumo Cloud. Conservative traders can use this simple rule to gauge high-probability entries and exits in the forex market, as demonstrated in the annotated example of the same chart shown below:

In this example, the entry positions occur when the candlesticks have risen above the cloud and both moving-average lines (Note the two “Green” circles). The exit points are then delivered when the price closes below one of the two indicator lines (Note the two “Red” circles). With this simple trading formula, two favorable trades occurred, but volumes have been written describing a host of other signals that this useful tool can reveal, but more study is required.
Of course, no trading system is ever correct all the time. As much as we wish it were not so, the past is never a guarantee of future results, but a trader’s objective is to gain an “edge”. A “60/40” ratio is all that is needed to be successful, but discipline, prudent money and risk management principles, and emotional control can help. If “one view” helps, let Ichimoku guide you.
Written by forextraders.com

