
Hello fellow traders. In this technical article, we are going to present Elliott Wave charts of GOLD (XAUUSD). In the following sections, we’ll break down the Elliott Wave structure in detail and explain the forecast and present the target levels.
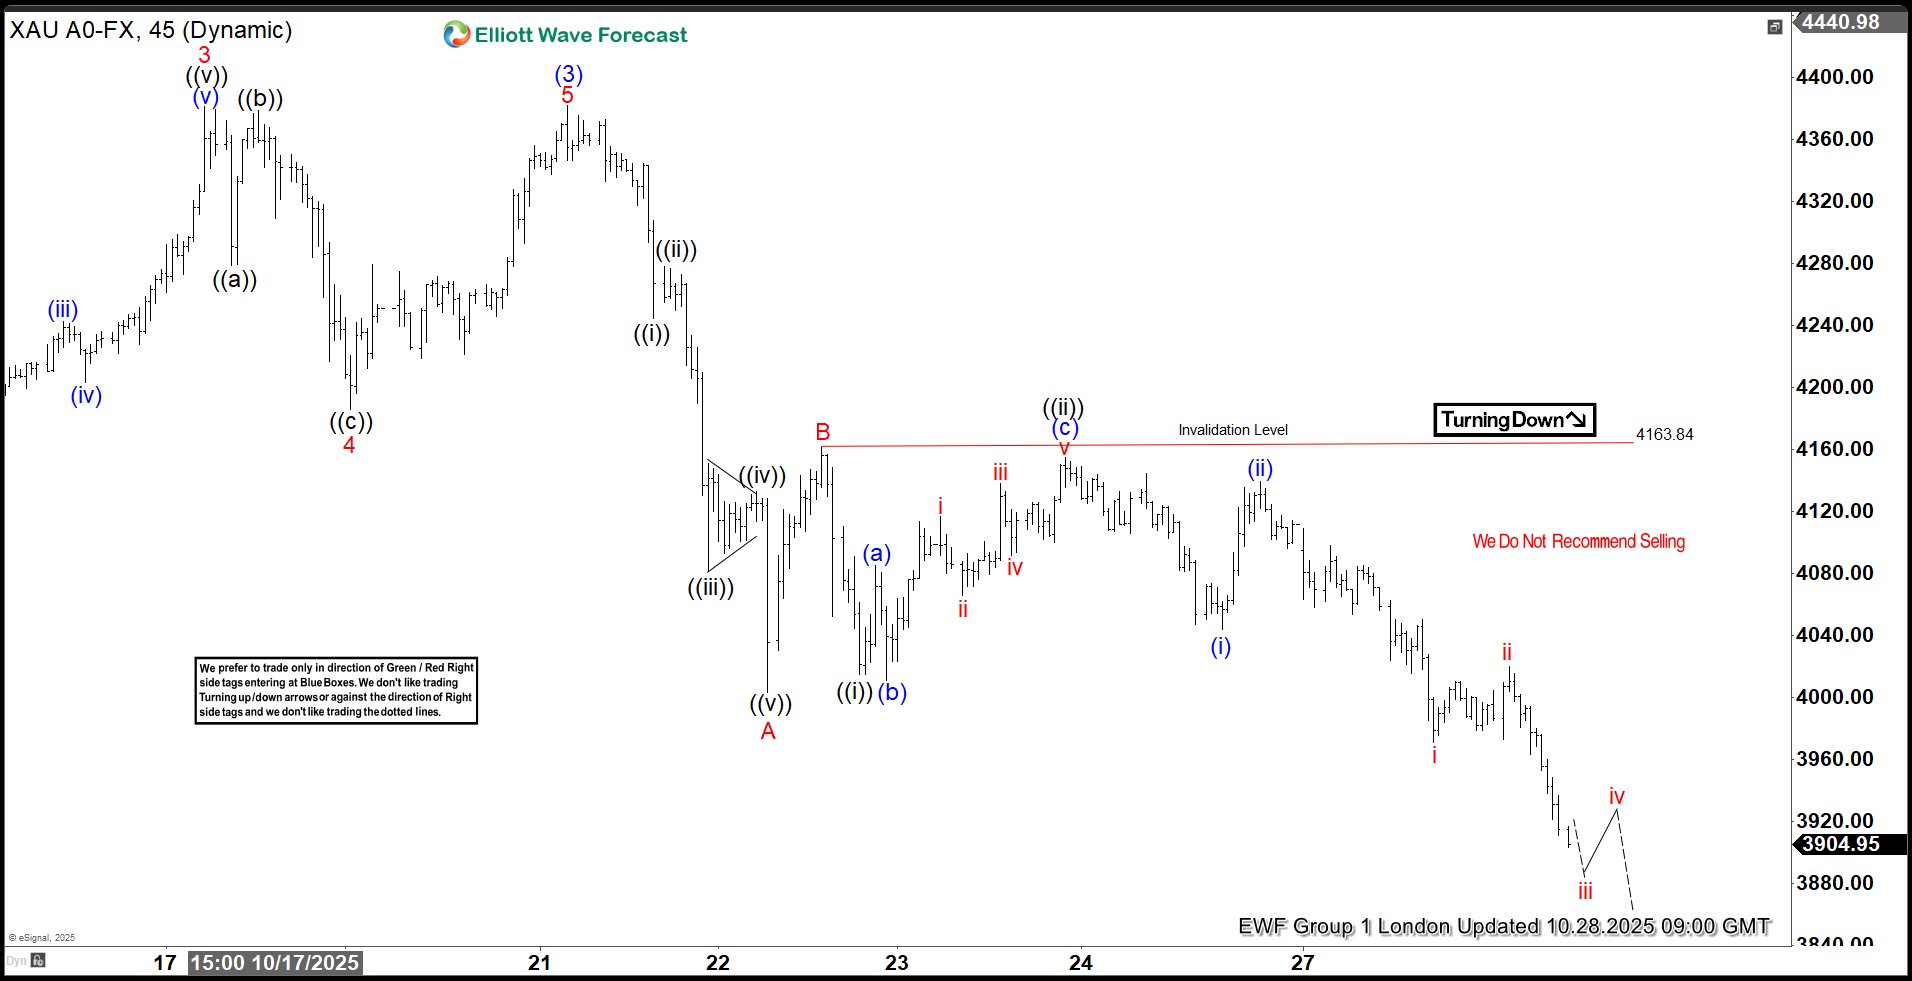
GOLD Elliott Wave 1 Hour Chart 10.28.2025
GOLD has broken the previous low at 4012.3, marked as A red on the chart. This break has made the swing sequences from the 4382.5 peak incomplete, confirming further downside extension. The commodity is potentially forming an Elliott Wave Zigzag pattern, due to the fact that the first leg shows a 5-wave structure. As long as the price holds below the 4163.8 peak, we can continue to expect lower prices within the C red leg, targeting the 3927–3865 area next
90% of traders fail because they don’t understand market patterns. Are you in the top 10%? Test yourself with this advanced Elliott Wave Test
Official trading strategy on How to trade 3, 7, or 11 swing and equal leg is explained in details in Educational Video, available for members viewing inside the membership area.

GOLD Elliott Wave 1 Hour Chart 10.28.2025
GOLD continued trading lower as expected. The first target area at 3927–3865 has been reached. The main target comes around the 3785 area, where we would like to be buyers again if it gets reached.
Reminder for members: Our chat rooms in the membership area are available 24 hours a day, providing expert insights on market trends and Elliott Wave analysis. Don’t hesitate to reach out with any questions about the market, Elliott Wave patterns, or technical analysis. We’re here to help
Source: https://elliottwave-forecast.com/commodities/gold-xauusd-elliott-wave-incomplete/