
Ford Motor Company is an American multinational automobile manufacturer headquartered in Dearborn, Michigan, United States. It was founded by Henry Ford and incorporated on June 16, 1903. The company sells automobiles and commercial vehicles under the Ford brand, and luxury cars under its Lincoln luxury brand.
FORD (F) Daily Chart December 2023
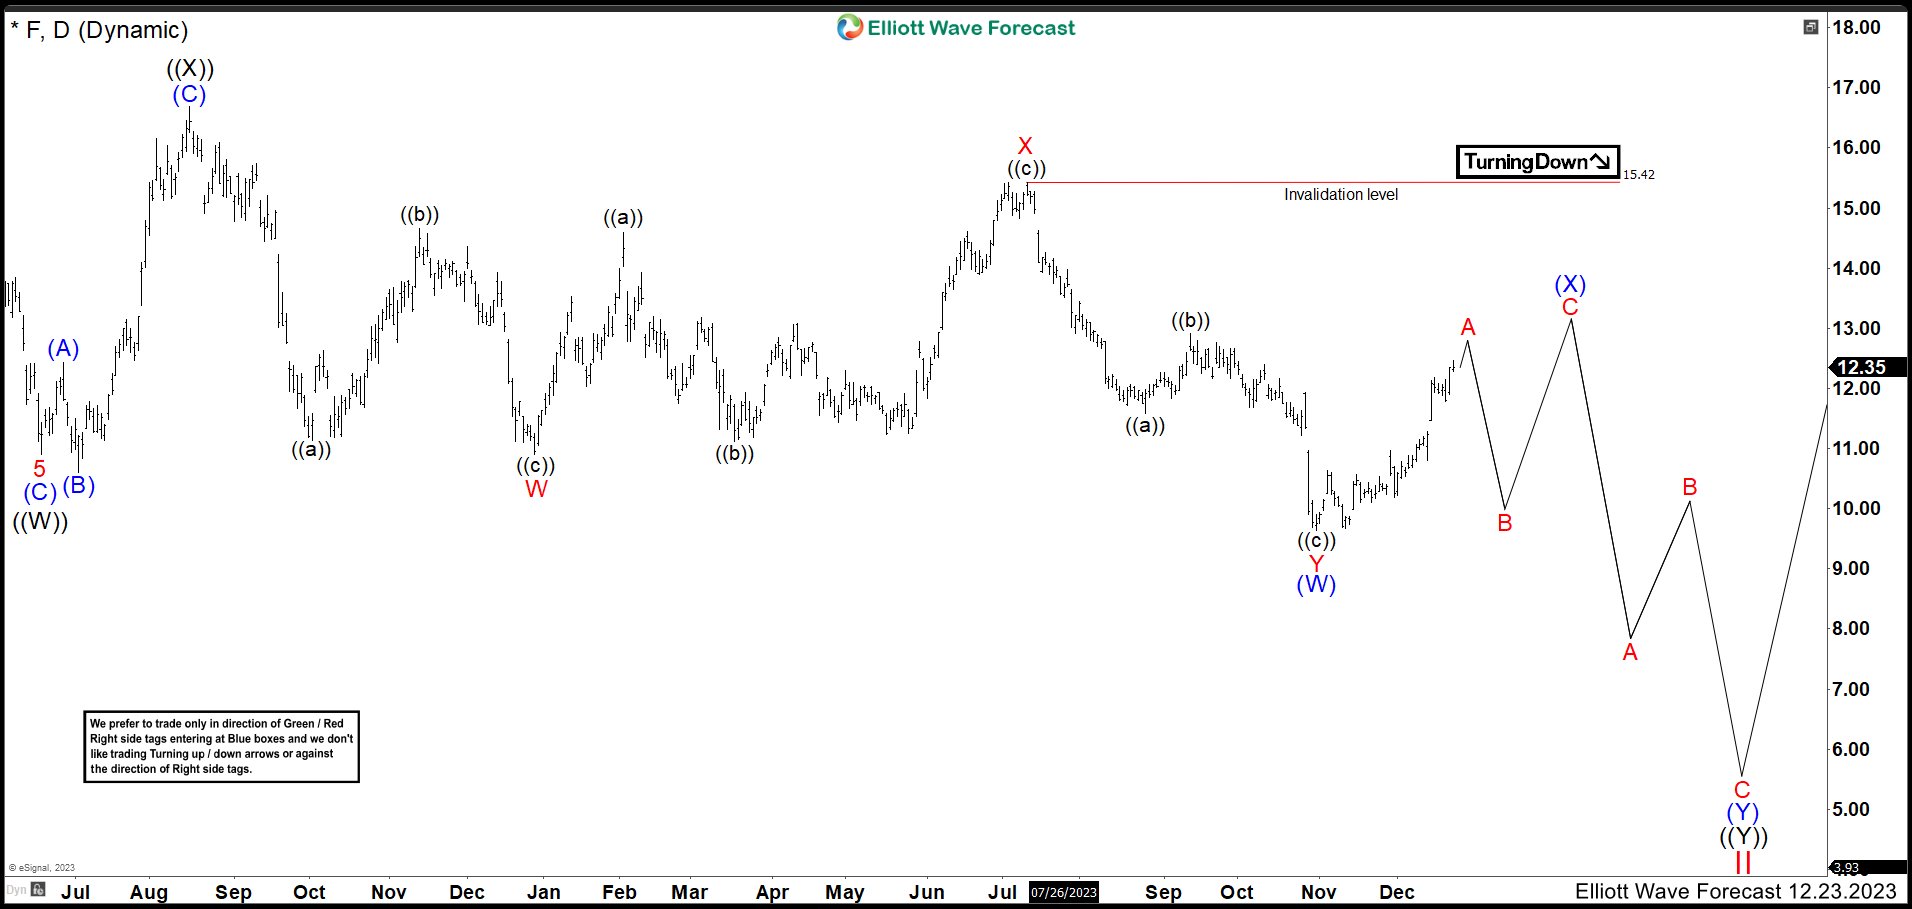
In January 2022 Ford made a high at 25.87 and we called wave I and the market started a wave II correction. Down from this high, the stock developed a zig zag correction ending at 10.90 low and we called wave ((W)). Since then, shares entered in a sideways phase. In this range, after ((W)) a flat correction took a part building wave ((X)) connector ending at 16.68 high. Market continued lower and we are expecting a double correction (W), (X), (Y) to complete wave ((Y)). Down from August 2022 high, we can see 3 swings lower ending wave W at 10.90. Then, market bounce in 3 swings higher as a flat correction finishing wave X at 15.42. Then, another 3 swings zig zag correction fell completing wave Y at 9.63 low and also wave (W).
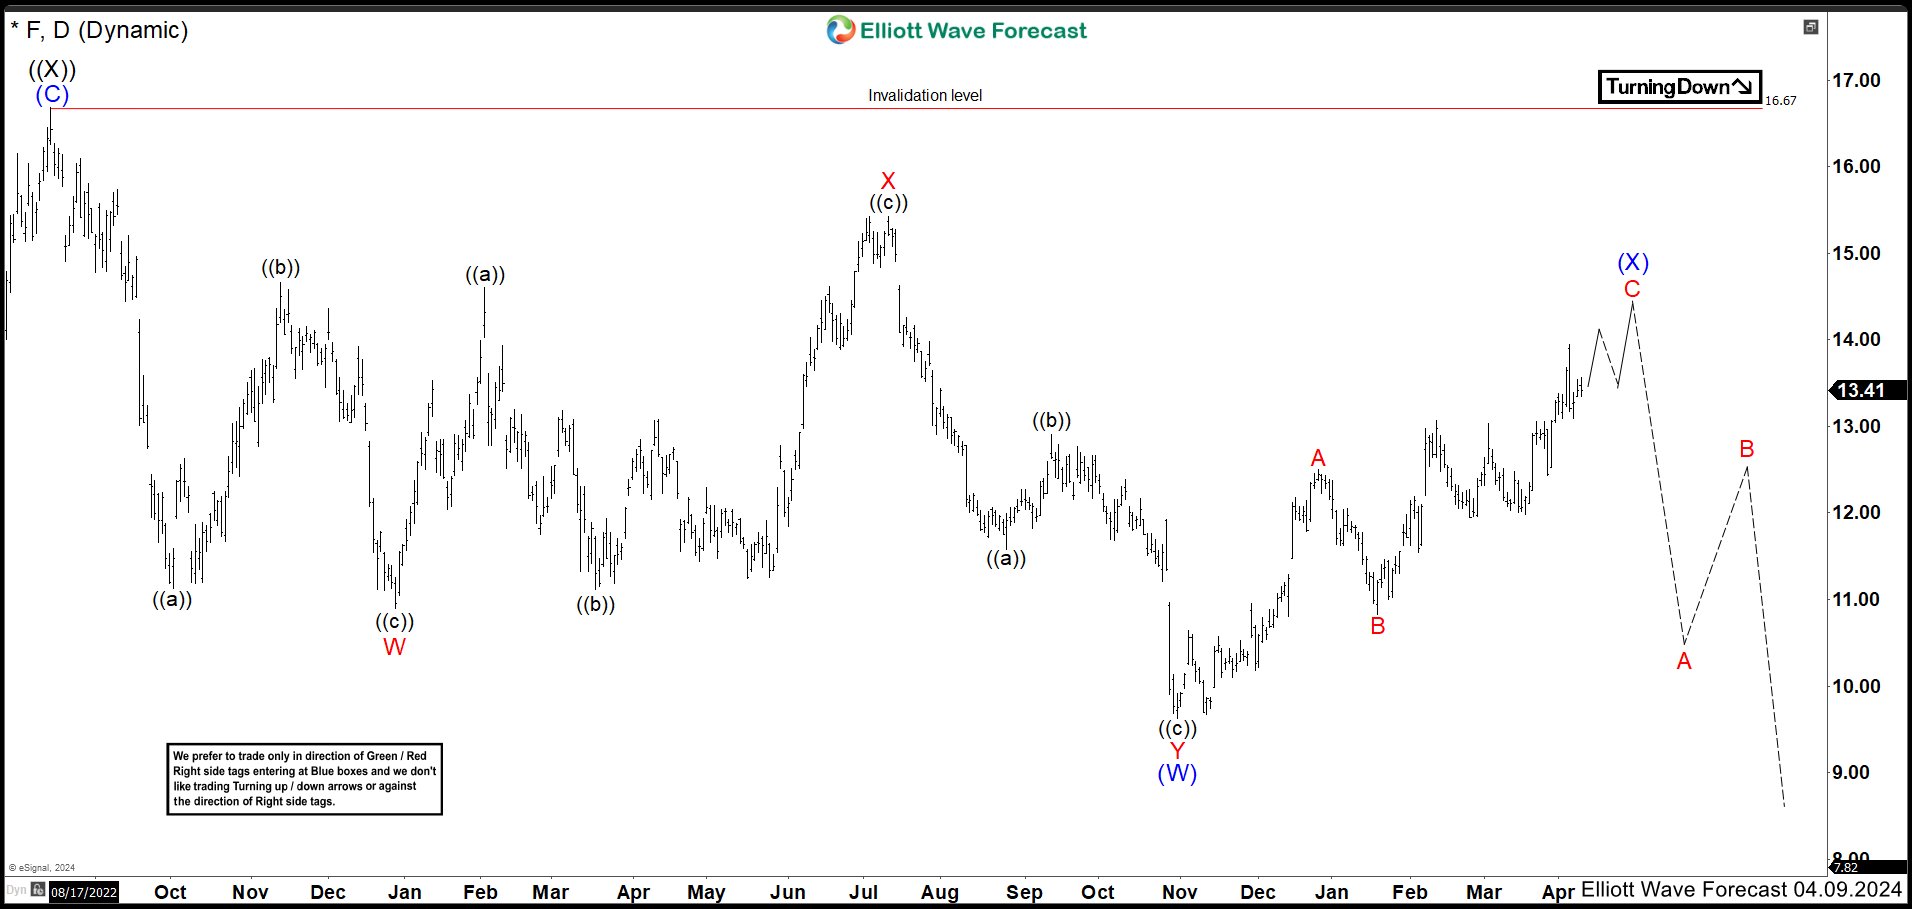
FORD (F) Daily Chart April 2024
The rally from wave (W) low is developing a 3 swings structure to end wave (X). First leg higher ended wave A of (X) at 12.5 and wave B pullback finished at 10.82. Current price action should continue higher to reach 14.41 – 14.83 area to end wave (X). Once wave (X) is completed, Ford should see 3 swings more lower to end wave (Y) of ((Y)) of II before rally in a new upside cycle. In conclusion, market needs to breaks below 9.63 to confirm the view and stays below 16.67 high. If market breaks above 16.67, the wave II correction will be completed and we are going to look for buying opportunities only.
Source: https://elliottwave-forecast.com/stock-market/ford-lower-prices-correction/