
In this technical blog, we will look at the past performance of the 1-hour Elliott Wave Charts of SPX. We presented to members at the elliottwave-forecast. In which, the rally from the 05 January 2024 low unfolded as an impulse structure and showed a bullish sequence. Suggested that the index should see more upside extension to complete the impulse sequence. Therefore, we advised members not to sell the index & buy the dips in 3, 7, or 11 swings at the blue box areas. We will explain the structure & forecast below:
SPX 1-Hour Elliott Wave Chart From 4.05.2024
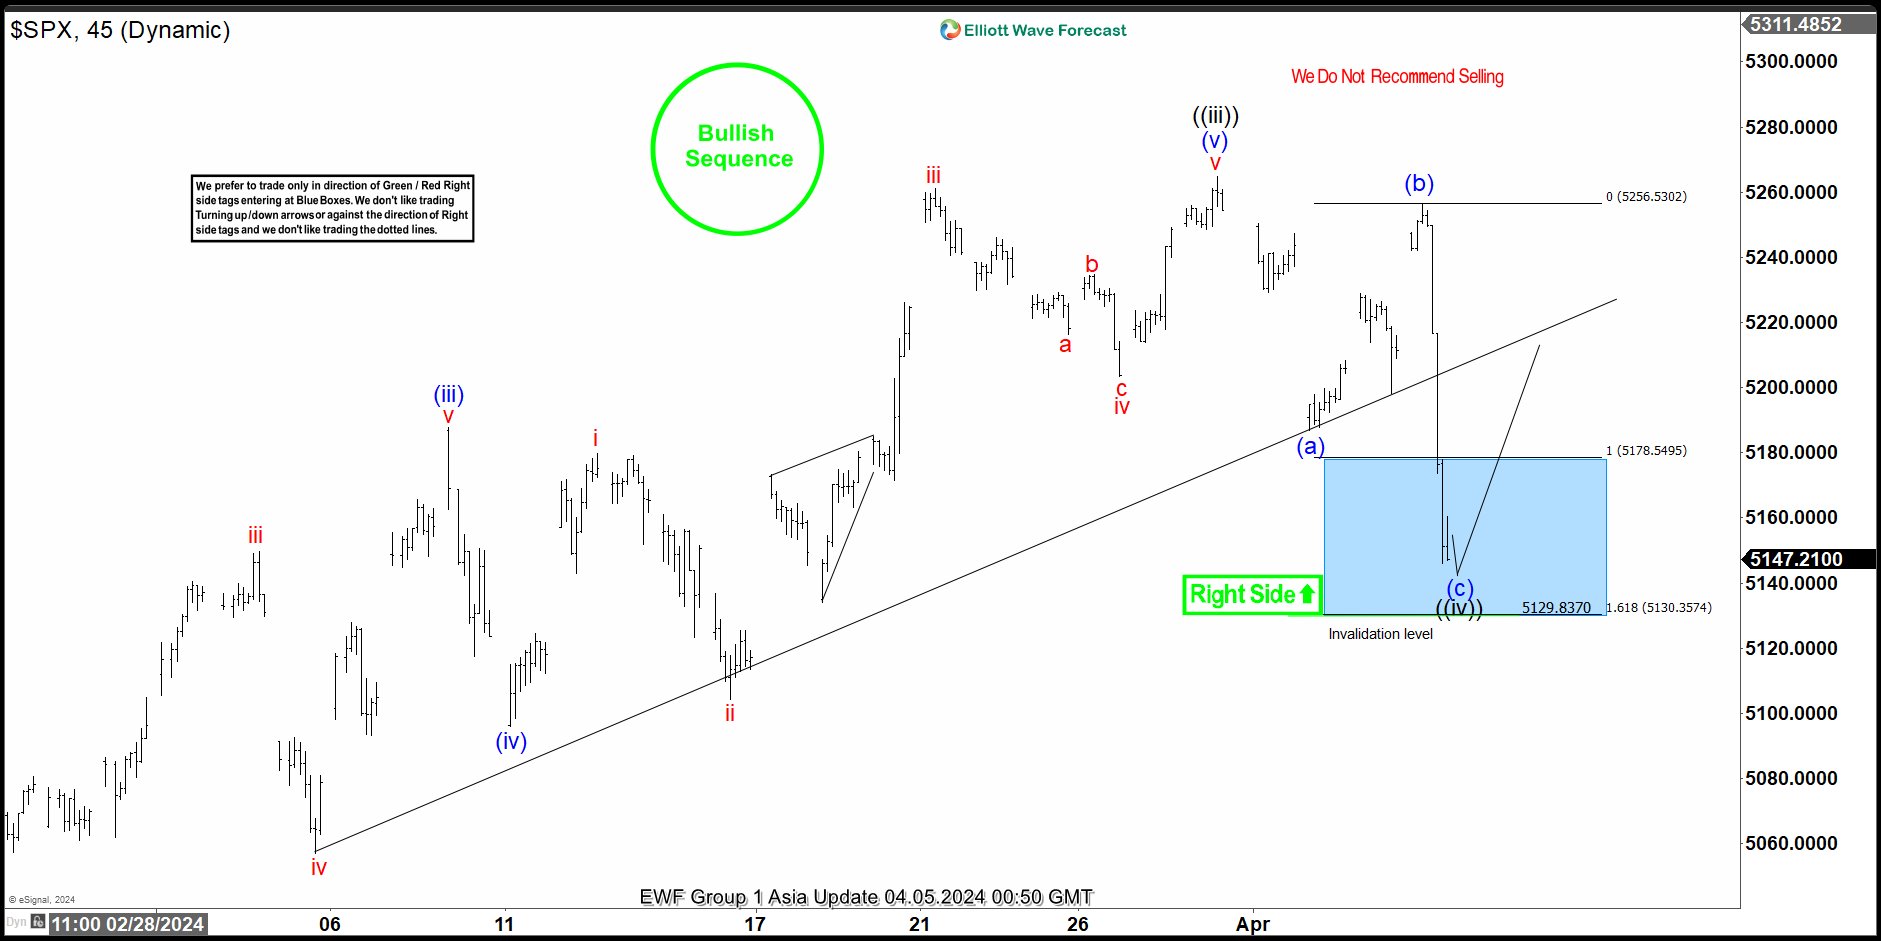
Here’s the 1-hour Elliott wave chart from the 4/05/2024 Asia update. In which, the short-term cycle from the 1/17/2024 low ended in wave ((iii)) as impulse at $5264.85 high. Down from there, the index made a pullback in wave ((iv)) to correct that cycle. The internals of that pullback unfolded as Elliott wave zigzag structure where wave (a) ended at $5186.71 low. Wave (b) bounce ended at $5256.59 high and wave (c) managed to reach the blue box area at $5178.54- $5130.35. From there, buyers were expected to appear looking for the next leg higher or for a 3 wave bounce minimum.
SPX Latest 1-Hour Elliott Wave Chart 4.09.2024
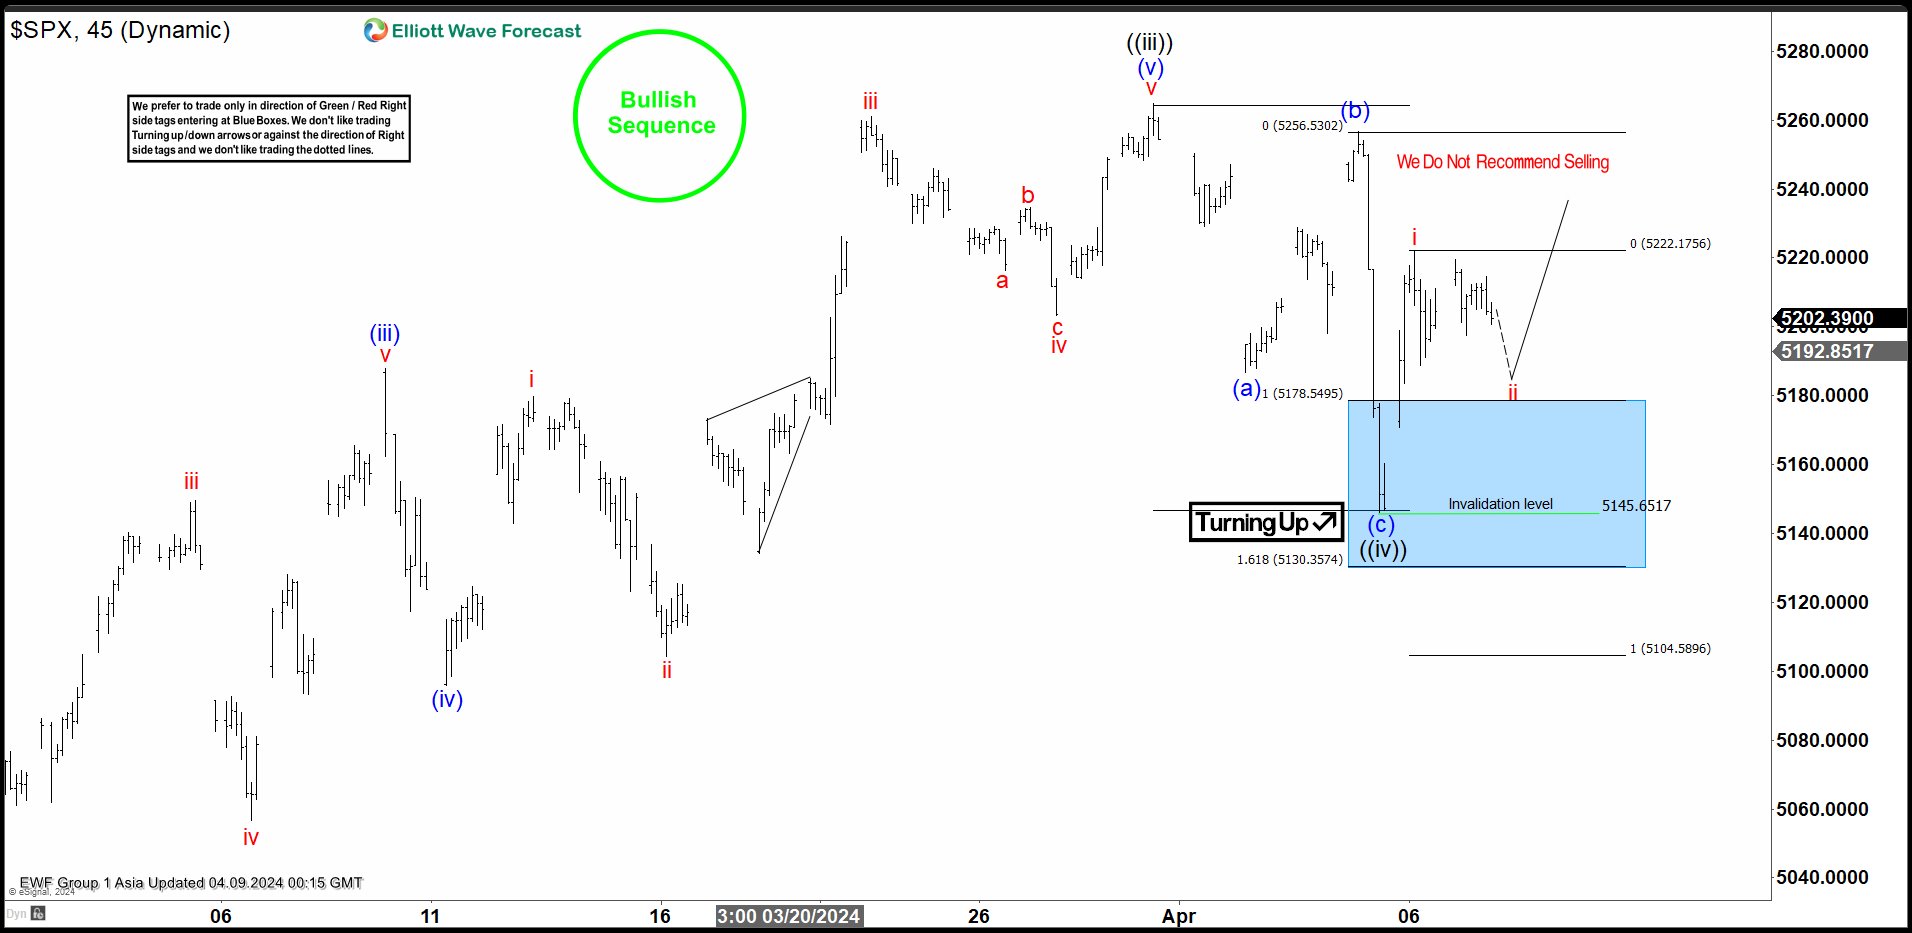
This is the latest 1-hour Elliott wave Chart from the 4/09/2024 Asia update. In which the index is showing a reaction higher taking place, right after ending the zigzag correction within the blue box area. Allowed members to create a risk-free position shortly after taking the long position at the blue box area. However, a break above $5264.85 high is still needed to confirm the next extension higher towards $5292- $5338 area higher and avoid double correction lower.
Source: https://elliottwave-forecast.com/stock-market/spx-perfect-buying-opportunity-blue-box/